Car Ownership Statistics 2026
If you own a car, you’re part of the 92 percent of Americans who do.
Get quotes from providers in your area

Last updated: June 10, 2026
Key Findings: Car Ownership Statistics 2026
Based on the latest United States Census data, 92 percent of American households own at least one car.
As of the most recent data, there were nearly 285 million private and commercial vehicles registered in the country.
Delaware, New Jersey, New York and Washington, D.C., have the highest ratios of licensed drivers to registered vehicles. In Montana, Wyoming, South Dakota and North Dakota, cars outnumber licensed drivers by around two to one or more.
BMWs are the most popular vehicle in high-income households. Chevrolet, Ford, Toyota and Honda are popular across income levels.
Adults 45 and older are most likely to own cars.
In 2024, electric vehicles (EVs) accounted for about 8 percent of new vehicle registrations.
Second to housing, car ownership is the biggest financial cost for most Americans. Public transportation isn’t accessible nationwide, so most people depend on cars in their everyday lives. We’ve compiled the most important car ownership statistics you need to know, examining trends from 1960 to today and beyond.
How Many Cars Are There in the U.S.?
There are about 285 million private and commercial vehicles registered in the United States.
How Many Americans Own Cars?
The average American is a car owner. Across the country, 92 percent of American households have one vehicle or more, according to the latest U.S. Census data. 37 percent of households own two cars while 33 percent own one. Twenty-two percent own three or more cars.1

| Number of vehicles per household | Percentage of U.S. households |
|---|---|
| Households with 0 vehicles | 8% |
| Households with 1 vehicle | 33% |
| Households with 2 vehicles | 37% |
| Households with 3 or more cars | 22% |
Vehicle Registration by Year
The number of registered vehicles in the U.S. has climbed steadily over the past two decades. In 2023, there were about 91 million more registered vehicles than in 1990 or an increase of about 47 percent. There were nearly 279 million private and commercial vehicles registered in the country and about 285 million total (including publicly owned) registered vehicles.2
| Year | Number of registered vehicles in the U.S. (in millions) |
|---|---|
| 1990 | 193.1 |
| 1991 | 192.3 |
| 1992 | 194.4 |
| 1993 | 198.0 |
| 1994 | 201.8 |
| 1995 | 205.4 |
| 1996 | 210.4 |
| 1997 | 211.6 |
| 1998 | 215.5 |
| 1999 | 220.5 |
| 2000 | 225.8 |
| 2001 | 235.3 |
| 2002 | 234.6 |
| 2003 | 236.8 |
| 2004 | 243.0 |
| 2005 | 247.4 |
| 2006 | 250.8 |
| 2007 | 254.4 |
| 2008 | 255.9 |
| 2009 | 254.2 |
| 2010 | 250.1 |
| 2011 | 253.1 |
| 2012 | 253.6 |
| 2013 | 255.9 |
| 2014 | 260.4 |
| 2015 | 263.6 |
| 2016 | 268.8 |
| 2017 | 272.5 |
| 2018 | 273.6 |
| 2019 | 276.5 |
| 2020 | 275.9 |
| 2021 | 282.2 |
| 2022 | 283.4 |
| 2023 | 284.6 |
In 2024, 79 percent of new vehicles were bought or financed while 21 percent were leased.3
By Location
Registered Cars in Each State
In most states, the driver-to-vehicle ratio is close to one-to-one. In a few states — Montana, Wyoming, South Dakota and North Dakota — cars outnumber licensed drivers by around two to one or more.4
| State | All private and commercial motor vehicles registered in the U.S., 20235 |
|---|---|
| Alabama | 5,446,619 |
| Alaska | 680,974 |
| Arizona | 6,447,062 |
| Arkansas | 3,338,322 |
| California | 31,057,329 |
| Colorado | 5,211,580 |
| Connecticut | 2,837,111 |
| Delaware | 445,240 |
| Florida | 19,519,552 |
| Georgia | 9,195,822 |
| Hawaii | 1,262,693 |
| Idaho | 2,057,655 |
| Illinois | 10,139,685 |
| Indiana | 5,775,462 |
| Iowa | 3,827,780 |
| Kansas | 2,472,852 |
| Kentucky | 4,551,497 |
| Louisiana | 4,522,457 |
| Maine | 1,366,649 |
| Maryland | 4,935,108 |
| Massachusetts | 5,239,321 |
| Michigan | 9,907,454 |
| Minnesota | 5,848,091 |
| Mississippi | 2,228,844 |
| Missouri | 5,504,704 |
| Montana | 2,357,075 |
| Nebraska | 1,974,401 |
| Nevada | 2,681,539 |
| New Hampshire | 1,405,435 |
| New Jersey | 5,991,811 |
| New Mexico | 1,909,072 |
| New York | 9,361,933 |
| North Carolina | 8,752,729 |
| North Dakota | 1,060,838 |
| Ohio | 11,242,160 |
| Oklahoma | 3,410,923 |
| Oregon | 4,230,276 |
| Pennsylvania | 10,866,252 |
| Rhode Island | 822,447 |
| South Carolina | 5,283,221 |
| South Dakota | 1,384,940 |
| Tennessee | 6,950,844 |
| Texas | 23,477,492 |
| Utah | 3,084,536 |
| Vermont | 629,430 |
| Virginia | 7,922,073 |
| Washington | 7,444,189 |
| Washington, D.C. | 344,088 |
| West Virginia | 1,515,512 |
| Wisconsin | 5,800,567 |
| Wyoming | 890,622 |
Cities With the Lowest and Highest Car Ownership Rates
According to the most recent Census Bureau data, densely populated cities with robust public transportation systems like New York, Boston, Philadelphia, Chicago and San Francisco have the lowest car ownership rates in the U.S.6
That said, the majority of Americans own cars, even in major cities. In the New York-Newark-Jersey City metropolitan area, which has the lowest rate of car ownership in the country, about seven in 10 households still own a car.
The Daphne-Fairhope-Foley metropolitan area — a suburb of Mobile, Alabama — and Provo, Utah have some of the highest rates of vehicle ownership. In these areas, 98 percent of households have at least one car and nearly 70 percent of households have at least two cars.
Lowest Car Ownership Rates
| Geographic Area | Vehicle ownership rate | Estimated vehicles per household | Households with 1 vehicle | Households with 2 vehicles | Households with 3 or more vehicles |
|---|---|---|---|---|---|
| New York-Newark-Jersey City, NY-NJ-PA Metro Area | 70% | 1.19 | 33% | 25% | 12% |
| Ithaca, NY Metro Area | 87% | 1.50 | 37% | 36% | 14% |
| Boston-Cambridge-Newton, MA-NH Metro Area | 87% | 1.56 | 35% | 36% | 16% |
| Philadelphia-Camden-Wilmington, PA-NJ-DE-MD Metro Area | 88% | 1.57 | 35% | 35% | 17% |
| Atlantic City-Hammonton, NJ Metro Area | 88% | 1.61 | 34% | 35% | 19% |
| Chicago-Naperville-Elgin, IL-IN-WI Metro Area | 88% | 1.58 | 36% | 35% | 17% |
| Buffalo-Cheektowaga, NY Metro Area | 88% | 1.52 | 38% | 36% | 14% |
| San Francisco-Oakland-Berkeley, CA Metro Area | 88% | 1.64 | 34% | 34% | 21% |
| Trenton-Princeton, NJ Metro Area | 88% | 1.60 | 34% | 36% | 18% |
| Binghamton, NY Metro Area | 89% | 1.57 | 37% | 35% | 17% |
Highest Car Ownership Rates
| Geographic Area | Vehicle ownership rate | Estimated vehicles per household | Households with 1 vehicle | Households with 2 vehicles | Households with 3 or more vehicles |
|---|---|---|---|---|---|
| Daphne-Fairhope-Foley, AL Metro Area | 98% | 1.89 | 31% | 43% | 24% |
| Provo-Orem, UT Metro Area | 98% | 2.12 | 19% | 42% | 36% |
| St. George, UT Metro Area | 97% | 1.97 | 26% | 41% | 29% |
| Logan, UT-ID Metro Area | 97% | 2.10 | 20% | 40% | 37% |
| Ogden-Clearfield, UT Metro Area | 97% | 2.07 | 21% | 40% | 36% |
| Boise City, ID Metro Area | 97% | 1.98 | 25% | 41% | 30% |
| Colorado Springs, CO Metro Area | 97% | 1.91 | 29% | 41% | 27% |
| Greeley, CO Metro Area | 97% | 2.06 | 22% | 39% | 36% |
| Hilton Head Island-Bluffton, SC Metro Area | 97% | 1.74 | 36% | 44% | 17% |
| The Villages, FL Metro Area | 97% | 1.42 | 59% | 29% | 9% |
By Demographics
Income Level
The people most likely to own cars in the U.S. are those who make between $50,000 to $74,999 a year.78
| Income | Percentage of all U.S. car owners in 2021 | Percentage of U.S. population in 2021 | Difference |
|---|---|---|---|
| Under $49,999 | 16% | 36% | -56% |
| $50,000-$74,999 | 34% | 16% | 108% |
| $75,000-$99,999 | 21% | 12% | 81% |
| $100,000-$149,999 | 20% | 16% | 25% |
| Unknown or not matched | 9% | n/a | n/a |
The most popular make of vehicle owned or leased by high-income households is a BMW, with 16 percent of Statista survey respondents in that income bracket saying their household has a Beamer. Chevrolet, Ford, Toyota and Honda are popular vehicles across income levels.9
Five most popular vehicle makes for high-income households:
- BMW (16 percent)
- Ford (10 percent)
- Toyota (10 percent)
- Chevrolet (9 percent)
- Honda (7 percent)
Five most popular vehicle makes for medium-income households:
- Ford (14 percent)
- Chevrolet (13 percent)
- Toyota (11 percent)
- Honda (10 percent)
- Nissan (7 percent)
Five most popular vehicle makes for low-income households:
- Chevrolet (16 percent)
- Ford (13 percent)
- Toyota (10 percent)
- Dodge (7 percent)
- Honda (7 percent)
Age
People aged 45 and older are the most likely age group to own cars. Age and car ownership are directly correlated: The older you are, the more likely you are to own a car and the more cars you own.
| Age group | Percent of car owners in the U.S. in 2021 | Percentage of U.S. population in 2021 |
|---|---|---|
| 24 and younger | 0.02% | 16% |
| 25-29 | 1% | 8% |
| 30-34 | 3% | 9% |
| 35-39 | 5% | 8% |
| 40-44 | 7% | 8% |
| 45-49 | 8% | 7% |
| 50-54 | 11% | 8% |
| 55-59 | 12% | 8% |
| 60-64 | 13% | 8% |
| 65-69 | 12% | 7% |
| 70-74 | 10% | 6% |
| 75-79 | 7% | 4% |
| 80-84 | 5% | 2% |
| 85 and older | 6% | 2% |
Race
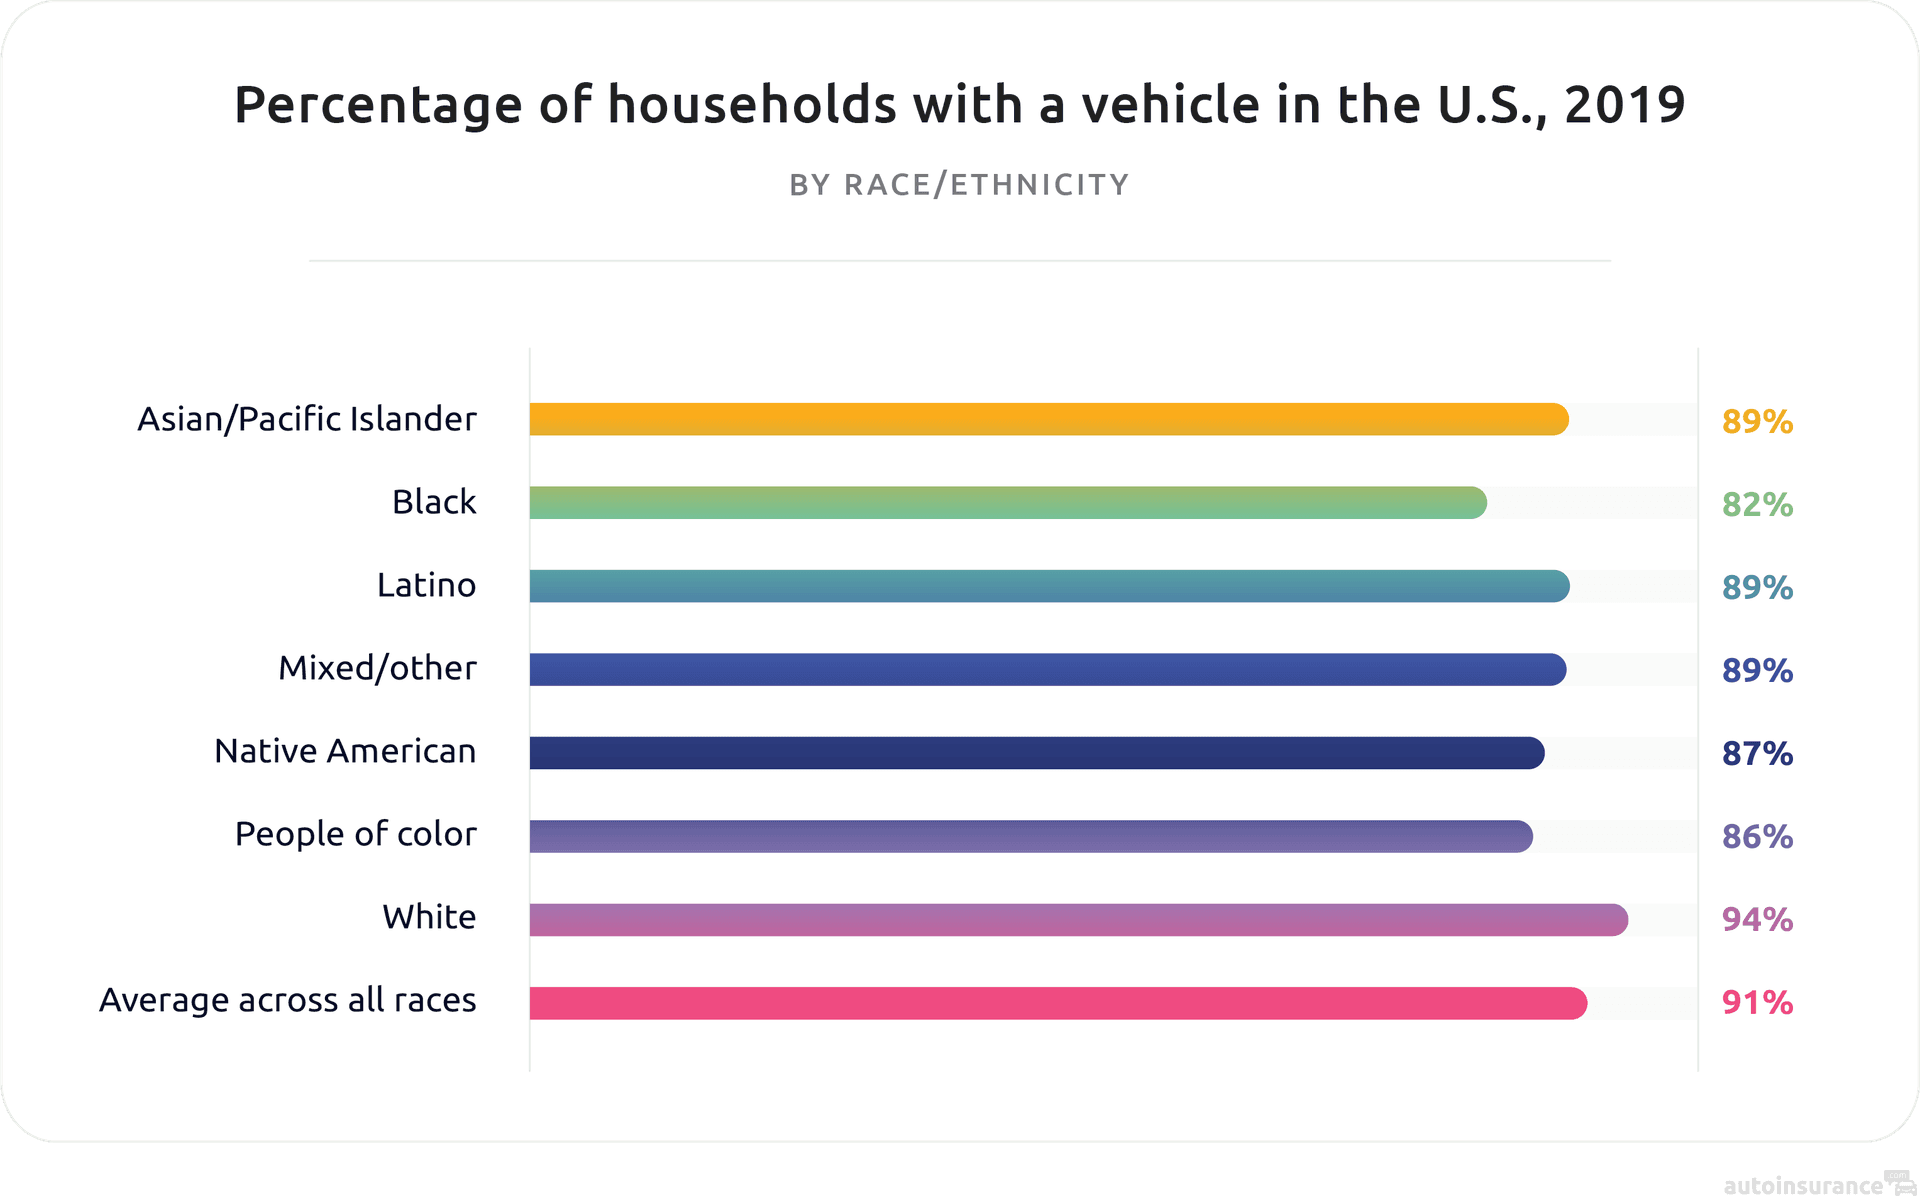
Black households are 10 percent less likely to live in households with vehicles and have access to a vehicle compared to the general population. On the opposite end of the spectrum, 94 percent of white households have vehicles. The average percentage of households with vehicles across all races is 91 percent.10
A 2024 study found that 76 percent of Black households are burdened with transportation spending (defined as spending more than 15 percent of monthly income on vehicle expenses), compared to 60 percent of white households. Across income levels and including high-income households, Black households spend a larger portion of their yearly budget on transportation. Finally, low-income Black households spend an average of $1,115 more per vehicle each year compared to low-income white households. These findings highlight the disparities even among vehicle owners, underscoring how access to transportation—essential for livelihood and economic opportunity—places a disproportionate financial burden on certain communities.11
Car Type
Crossovers have the largest segment of the U.S. vehicle market share. They make up 49 percent of the total vehicles on the market.12
| Car type | Market share (as of December 2025) |
|---|---|
| Crossover | 49% |
| Pickup | 19% |
| SUV | 10% |
| Midsize and Large | 6% |
| Small | 8% |
| Luxury | 4% |
| Van | 5% |
Electric
In 2024, all-EVs accounted for 7.9 percent of new vehicle registrations.13 In 2023, there were over 3.5 million EVs registered across all 50 states and Washington, D.C.14 California, Colorado, and Washington had the highest rates of the EV market share in the U.S.
Luxury
Only 4 percent of cars on the market are in the luxury class, which includes brands such as Bentley, Mercedes-Benz, BMW, Audi, Lexus and Jaguar, according to data from the National Automobile Dealers Association.
The Cost of Car Ownership by Year
In 1960, Americans spent a total of $17 billion on new and used cars. By 2021, that number ballooned to over $590 billion, a difference of 3,370 percent. Spending dipped during the Great Recession (2007 to 2009) but began climbing again in 2010, with a sharp increase during the pandemic. U.S. expenditures on new and used cars increased by 29 percent between 2020 and 2021, according to U.S. Department of Transportation data.15
| Year | Spending on new and used cars (in billions of dollars) |
|---|---|
| 1960 | 17.1 |
| 1970 | 28.5 |
| 1980 | 66.5 |
| 1990 | 176.9 |
| 1995 | 220.3 |
| 1996 | 235.8 |
| 1997 | 254.0 |
| 1998 | 280.7 |
| 1999 | 309.7 |
| 2000 | 321.4 |
| 2001 | 342.0 |
| 2002 | 359.7 |
| 2003 | 357.4 |
| 2004 | 362.2 |
| 2005 | 359.3 |
| 2006 | 341.5 |
| 2007 | 344.3 |
| 2008 | 287.9 |
| 2009 | 265.7 |
| 2010 | 287.9 |
| 2011 | 304.4 |
| 2012 | 333.3 |
| 2013 | 352.1 |
| 2014 | 375.2 |
| 2015 | 405.5 |
| 2016 | 412.7 |
| 2017 | 428.7 |
| 2018 | 445.5 |
| 2019 | 439.5 |
| 2020 | 454.3 |
| 2021 | 594.3 |
Traffic Fatalities by Car Type
The type of car accounting for the highest death rate is a four-door mini car, with traffic fatality rates 221 percent higher than the average across all car types. In contrast, a four-wheel-drive luxury SUV has the lowest traffic fatality rates — 85 percent lower than average. This data is based on car models from 2015 to 2018.16
| Car type | Size | Total number of deaths per million registration years |
|---|---|---|
| 4-door car | Mini | 108 |
| 2-door car | Large | 67 |
| Station wagons | Mini | 65 |
| 4-door car | Small | 62 |
| 4-door car | Large | 52 |
| Sports car | Midsize | 51 |
| Cars | n/a | 48 |
| Sports car | Large | 48 |
| 2-door car | Small | 45 |
| 2-door car | Midsize | 44 |
| 2-wheel drive luxury SUV | Small | 44 |
| 4-door car | Midsize | 43 |
| 2-wheel drive SUV | Small | 42 |
| 2-door car | Mini | 41 |
| 2-wheel drive pickup | Large | 38 |
| Overall | n/a | 36 |
| 2-wheel drive SUV | Midsize | 34 |
| 2-wheel drive pickup | Small | 31 |
| 2-wheel drive SUV | Very large | 30 |
| Pickups | n/a | 29 |
| 2-wheel drive pickup | Very large | 28 |
| 4-wheel drive pickup | Very large | 27 |
| 2-wheel drive SUV | Large | 26 |
| 2-wheel drive luxury SUV | Large | 26 |
| 4-wheel drive pickup | Large | 26 |
| Station wagons | Midsize | 25 |
| SUVs | n/a | 25 |
| 4-wheel drive luxury SUV | Small | 25 |
| 4-wheel drive SUV | Small | 24 |
| 4-wheel drive pickup | Small | 24 |
| Luxury car | Midsize | 22 |
| Station wagons | Small | 22 |
| Minivans | n/a | 22 |
| 4-wheel drive SUV | Large | 22 |
| 4-wheel drive SUV | Midsize | 21 |
| Luxury car | Very large | 20 |
| Luxury car | Large | 19 |
| 4-wheel drive luxury SUV | Very large | 19 |
| 2-wheel drive luxury SUV | Midsize | 11 |
| 4-wheel drive luxury SUV | Midsize | 9 |
| 4-wheel drive SUV | Very large | 7 |
| 4-wheel drive luxury SUV | Large | 5 |
The Future of Car Ownership
Although car ownership has been on the rise for decades, with an average year-over-year increase in vehicle registrations in the U.S. of 1 percent, many factors make the future of car ownership uncertain.
For example, rideshare services, the normalization of work-from-home arrangements, increased availability of public transportation and the promise of self-driving cars may affect personal car ownership in the future. Not to mention the effects of rising fuel prices, high costs of living, economic woes and supply chain shortages.
According to Automotive World, a new trend may be Mobility as a Service (MaaS). Instead of owning cars outright, people would depend on the following carshare services:
- Car rental subscriptions like Zipcar
- Peer-to-peer sharing services like Getaround and Turo
- On-demand car-sharing
- Car clubs17
Similarly, the think tank RethinkX believes that by 2030, once the U.S. government has approved autonomous vehicles (AVs), 95 percent of U.S. passenger miles will be traveled using on-demand AVs. They also predict that fleets, not individuals, will own these AVs.18
RethinkX calls this new business model transport as a service (TaaS) and believes it will save the average U.S. family $5,600 annually in transportation costs, equal to a 10 percent wage increase.
Car Ownership and Insurance
Because leased cars have more insurance requirements than owned cars (mandating, for instance, collision and comprehensive coverage and gap insurance), they are sometimes more expensive to insure than owned cars. However, assuming you have the same coverage (new car replacement coverage is similar to gap coverage for owned vehicles, for example), leased vehicles may be no more expensive to insure than owned vehicles. Owned cars will only be cheaper to insure if you get minimum coverage — the bare minimum your state requires in auto insurance.
Conclusion
Although new technologies could affect the future of car ownership, for now, personal vehicles are here to stay, especially in places where public transportation isn’t widely available. As the cost of vehicles increases, we’ve researched the value of new vs. used cars. Our research on commuting in the U.S. dives into how people get to and from work, our rideshare statistics explore the use of Uber and Lyft and our EV research considers the future of EVs.
Methodology
We compiled this report using information from the following third parties:
- Automotive World
- Edmund’s
- Federal Highway Administration
- Infotur
- Insurance Institute for Highway Safety
- National Automobile Dealer’s Association
- National Equity Atlas
- Statista
- U.S. Census
- U.S. Department of Transportation
Frequently Asked Questions
According to the latest U.S. Census data, 92 percent of American households own at least one vehicle. Of those, 37 percent own two cars, 33 percent own one, and 22 percent own three or more.
As of 2023, there are approximately 285 million registered private and commercial vehicles in the United States, up from about 193 million in 1990.
New York, Boston, Philadelphia, Chicago, and San Francisco have the lowest car ownership rates, largely due to dense populations and robust public transit. Even so, about 70 percent of households in the New York metro area — the lowest in the country — still own a car.
EVs are growing but still a small share of the market — in 2024, they accounted for about 8 percent of new vehicle registrations. California, Colorado, and Washington lead in EV adoption.
Sources
Car Ownership. United States Census Bureau. (2024).
https://data.census.gov/table?q=car%20ownershipNumber of motor vehicles registered in the United States from 1990 to 2022. Statista. (2023).
https://www.statista.com/statistics/183505/number-of-vehicles-in-the-united-states-since-1990/New and Used Passenger Car and Light Truck Sales and Leases. Bureau of Transportation Statistics. (2024).
https://www.bts.gov/content/new-and-used-passenger-car-sales-and-leases-thousands-vehiclesLicensed Drivers By Sex And Ratio To Population – 2022 (1). Federal Highway Administration. (2022).
https://www.fhwa.dot.gov/policyinformation/statistics/2022/dl1c.cfmSelected Housing Characteristics/em>. United States Census Bureau. (2024).
https://data.census.gov/table/ACSDP5Y2022.DP04?g=010XX00US$31000M1U.S. car owners as of 2021, by income group. Statista. (2022).
https://www.statista.com/statistics/1041177/us-car-owners-by-income-group/Income in the United States: 2021. United States Census. (2022, Sep 13).
https://www.census.gov/data/tables/2022/demo/income-poverty/p60-276.htmlVehicles used by people from American households in the United States as of March 2024, by income. Statista. (2024).
https://www.statista.com/statistics/241466/make-of-vehicles-owned-or-leased-by-affluent-americans/Car Access. National Equity Atlas. (2019).
https://nationalequityatlas.org/indicators/Car_access#/Black Households Are More Burdened by Vehicle Ownership than White Households. Molloy, Q., Garrick, N., & Atkinson-Palombo, C. (2024).
https://journals.sagepub.com/doi/abs/10.1177/03611981241231968Market Beat. National Automobile Dealers Association. (2022, Jun).
https://www.nada.org/media/5517/download?inlineMarket Beat NADA. (2025, June).
https://www.nada.org/media/17363/download?inlineElectric Vehicle Regristrations by State. U.S. Department of Energy. (2024).
https://afdc.energy.gov/data/10962Automobile Profile. Bureau of Transportation Statistics. (2022).
https://www.bts.gov/content/automobile-profileStatus Report. Insurance Institute for Highway Safety | Highway Loss Data Institute. (2020, May 28).
https://www.iihs.org/api/datastoredocument/status-report/pdf/55/2The future of car ownership will be data driven. Automotive World. (2022, Dec 15).
https://www.automotiveworld.com/articles/the-future-of-car-ownership-will-be-data-driven/Rethinking Transportation 2020-2030. RethinkX. (2017, May).
https://www.rethinkx.com/publications/rethinkingtransportation2017.en
Related Articles

The Safest Cars According to Insurance Loss Data
March 10, 2026
Guide to Buying a Used Car 2026
January 9, 2026
Microtransit: The Next Big Transportation Trend?
October 9, 2024