
The State of Potholes in the U.S.
In the U.S., pothole damage affects roughly 1 in every 10 drivers.
Get quotes from providers in your area

Last updated: March 27, 2026
Potholes may not seem like a huge risk to your car, but in the United States, around 10 percent of drivers need repairs due to potholes each year. Even if the pothole damage is from public roads, you can’t always get these repairs covered if you lack collision insurance. That means these holes in the road could be a big problem for you, especially during the colder times of year.
Key Takeaways
- In the U.S., around 10 percent of drivers had vehicle damage that required pothole repair in 2021, the latest year for which data is available.
- Pothole damage is 60 percent more common in the Northeast than in the South and West.
- Pothole damage cost U.S. drivers over $26 billion in repairs in 2021, or an average of $1,115 per driver.
- As a result of the Infrastructure Investment and Jobs Act, which passed in November 2021, the federal government is spending $1.57 million per mile to repair highways in poor condition, which includes potholes.
- The state with the highest amount of roads in poor condition is Texas, which has 19,400 miles of highways in poor condition as of 2020. As such, it is receiving the most federal aid for highway programs — $26.9 billion, compared with an average of $5.4 billion per state.
How Common Is Pothole Damage in the U.S.?
In 2021, 10 percent of U.S. drivers had vehicle repairs due to pothole damage, according to an AAA survey.1 That amounts to nearly 24 million drivers.2
The Northeast has the highest rate of pothole damage, according to recent data from Mavis Tire, which found that locations in the Northeast are seeing 60 percent more tire repairs per location than shops in the South and West.3 In the Northeast, over 10 percent of service visits are flat repairs — the highest percentage of any U.S. region.
AAA’s survey indicated that the average cost of repairing pothole damage is $600, and pothole damage cost drivers across the country a total of $26.5 billion in repairs in 2021. That comes out to around $1,115 per driver.
Infrastructure for Potholes in the U.S.
On Nov. 15, 2021, the Infrastructure Investment and Jobs Act (IIJA) passed and became law in a bipartisan victory.4 Part of the act focuses on improving highways in poor condition, which includes potholes. The federal government appropriated $273.8 billion between 2022 and 2026 to fix these highways.
| State | Average annual cost per driver from poor road conditions | Miles of highway in poor condition | Amount expected in federal aid for highway and bridge repairs |
|---|---|---|---|
| Alabama | $434 | 2,950 | $5,200,000,000 |
| Alaska | $402 | 570 | $4,400,000,000 |
| Arizona | $614 | 3,100 | $5,000,000,000 |
| Arkansas | $671 | 6,700 | $3,600,000,000 |
| California | $799 | 14,220 | $25,300,000,000 |
| Colorado | $651 | 3,600 | $3,700,000,000 |
| Connecticut | $711 | 2,100 | $3,500,000,000 |
| Delaware | $456 | 250 | $1,200,000,000 |
| District of Columbia | $1,100 | 402 | $1,100,000,000 |
| Florida | $425 | $3,564 | $13,100,000,000 |
| Georgia | $375 | 2,260 | $8,900,000,000 |
| Hawaii | $818 | 664 | $1,200,000,000 |
| Idaho | $394 | 1,102 | $2,000,000,000 |
| Illinois | $609 | 6,218 | $9,800,000,000 |
| Indiana | $638 | 5,478 | $6,600,000,000 |
| Iowa | $336 | 403 | $3,400,000,000 |
| Kansas | $509 | 1,995 | $2,600,000,000 |
| Kentucky | $444 | 1,322 | $4,600,000,000 |
| Louisiana | $667 | 3,411 | $4,800,000,000 |
| Maine | $543 | 1,438 | $1,300,000,000 |
| Maryland | $637 | 2,201 | $4,100,000,000 |
| Massachusetts | $620 | 1,194 | $4,200,000,000 |
| Michigan | $644 | 7,300 | $7,300,000,000 |
| Minnesota | $543 | $4,986 | $4,500,000,000 |
| Mississippi | $637 | 5,840 | $3,300,000,000 |
| Missouri | $743 | 7,576 | $6,500,000,000 |
| Montana | $472 | 1,485 | $2,800,000,000 |
| Nebraska | $461 | 1,125 | $2,000,000,000 |
| Nevada | $558 | 1,090 | $2,500,000,000 |
| New Hampshire | $476 | 698 | $1,100,000,000 |
| New Jersey | $713 | 3,995 | $6,800,000,000 |
| New Mexico | $767 | 3,822 | $2,500,000,000 |
| New York | $625 | 7,292 | $11,600,000,000 |
| North Carolina | $500 | 3,116 | $7,200,000,000 |
| North Dakota | $410 | 830 | $1,700,000,000 |
| Ohio | $506 | 4,925 | $9,200,000,000 |
| Oklahoma | $394 | 1,004 | $4,300,000,000 |
| Oregon | $256 | 1,287 | $3,400,000,000 |
| Pennsylvania | $620 | 7,540 | $11,300,000,000 |
| Rhode Island | $845 | 860 | $1,500,000,000 |
| South Carolina | $625 | 7,292 | $4,600,000,000 |
| South Dakota | $562 | 2,013 | $1,900,000,000 |
| Tennessee | $209 | 270 | $5,800,000,000 |
| Texas | $709 | 19,400 | $26,900,000,000 |
| Utah | $709 | 2,064 | $2,400,000,000 |
| Vermont | $517 | 666 | $1,400,000,000 |
| Virginia | $517 | 2,124 | $7,000,000,000 |
| Washington | $659 | 5,469 | $4,700,000,000 |
| West Virginia | $726 | 3,200 | $3,000,000,000 |
| Wisconsin | $547 | 1,949 | $5,200,000,000 |
| Wyoming | $295 | 380 | $1,800,000,000 |
Here are some other interesting findings regarding the Infrastructure Investment and Jobs Act, which references data from 2020:
- There are 174,740 miles of highway in poor condition in the U.S., an average of 3,426 per state.
- Under the new infrastructure bill, the federal government is spending an average of $5.4 billion per state to repair these damages.
- The state with the highest number of highways in poor condition is Texas, which has 19,400 miles of highway in poor condition. As such, it is receiving the most federal aid for highway programs, $26.9 billion. That’s 80 percent higher than the national average.
- On average, drivers pay $571 a year as a result of damage caused by driving on roads in poor condition. Washington, D.C., has the highest cost at $1,100 a year, followed by Rhode Island at $845 a year — 48 and 32 percent higher than the national average respectively.
States With the Best and Worst Maintained Roads
According to U.S. Department of Transportation data, the following states have the lowest and highest proportion of poorly maintained urban and rural roads.5 The condition of roads is measured by the international roughness index, which quantifies the roughness of the road surface.
This gives a better idea of how states are maintaining their roads proportionally to how much roadway they have — larger states like Texas and California have more miles of roadway in poor condition because they have more roads to begin with, but they are not on the list of states with the highest percentage of poorly maintained roads.
States with Best and Worst Urban Roads
| States With Lowest Percentage of Poorly Maintained Urban Roads | States With Highest Percentage of Poorly Maintained Urban Roads |
|---|---|
| Indiana | Rhode Island |
| Georgia | Wisconsin |
| Tennessee | Washington |
| Kansas | Hawaii |
| Wyoming | Arizona |
States with Best and Worst Rural Roads
| States With Lowest Percentage of Poorly Maintained Rural Roads | States With Highest Percentage of Poorly Maintained Rural Roads |
|---|---|
| Indiana | Hawaii |
| Florida | New Mexico |
| North Dakota | Rhode Island |
| Kansas | Mississippi |
| Ohio | Oklahoma |
Does the Government Pay for Pothole Damage?
If you get pothole damage from driving on public roads, can you sue the government for the cost of your repairs? The answer depends on where the damage occurred, as well as various state regulations.
Generally speaking, suing the government for damages related to potholes is very challenging, as you’ll need to prove the government knew, or reasonably should have known, about the damage and failed to repair it.6
Even if you can sue the government for pothole damage, you’ll still want to file a claim with your insurance provider if your damage is severe and it’s covered under collision coverage, or pay for the repairs out of pocket. Filing a claim usually isn’t worth it for minor damage.
If you’re looking to pursue legal action against the local government, it’s best to seek legal advice.
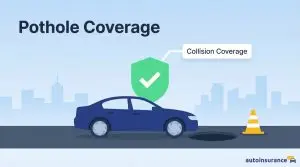
Potholes and Insurance
Collision coverage usually includes pothole coverage, though it won’t cover the normal wear and tear of a car due to bad road conditions. In order for damage to be covered, it needs to be the result of a specific incident of colliding with a pothole.
It’s also worth noting that if you hit a pothole and you file a claim for the repair, your auto insurance costs may increase. Hitting a pothole is a single-vehicle accident, so car insurance companies consider it your fault. The only exception is when you hit a pothole because another car hit you. If the damage is minor, it may not be worth filing a claim.
Recap
Pothole damage is extremely common in the U.S., particularly in the colder regions, and can be costly. If you have full coverage insurance, pothole damage is generally covered under collision coverage, but it may not be worth filing a claim for minor damage, as you still need to pay a deductible, and your rates may increase as a result.
Methodology
Our research was based on third-party sources from the following organizations, companies, and government agencies:
- AAA
- Congress.gov
- Federal Highway Administration/Department of Transportation
- Mavis Tire
- Nolo
Citations
AAA: Potholes Pack a Punch as Drivers Pay $26.5 Billion in Related Vehicle Repairs. AAA Newsroom. (2022, Mar 01).
https://newsroom.aaa.com/2022/03/aaa-potholes-pack-a-punch-as-drivers-pay-26-5-billion-in-related-vehicle-repairs/Highway Statistics 2023. U.S. Department of Transportation. (2025, Jan).
https://www.fhwa.dot.gov/policyinformation/statistics/2023/dl1c.cfmPothole Season Hits Hard: Flat Repairs Highest Per Auto Shop in the Northeast, Mavis Data Reveals Shift in Service Volume as a Result of Deteriorating Roads. Mavis Tires & Brake. (2025, July 31).
https://www.mavis.com/news/flat-tire-repair-trends-northeast-2025/H.R.3684 – Infrastructure Investment and Jobs Act. Congress Gov. (2022).
https://www.congress.gov/bill/117th-congress/house-bill/3684/textBureau of Transportation Statistics. United States Department of Transportation. (2026).
https://www.bts.gov/road-conditionCan I Sue the City If My Car Was Damaged By a Pothole? NOLO. (2025, Nov 17).
https://www.nolo.com/legal-encyclopedia/vehicle-damage-due-to-poor-road-conditions-who-is-liable.html
Related Articles

The State of Auto Theft in the U.S. in 2026
January 8, 2026
Road Hazard Coverage: Is It Worth It?
December 19, 2024