
The State of Teen Speeding in 2026
Teen speeding is a concern for almost 80 percent of parents.
Get quotes from providers in your area

Last updated: March 30, 2026
How Common Is Speeding?
Teens are more likely to speed and to allow less distance between themselves and the car in front of them — a dangerous practice.1 Overall, 43 percent of drivers ages 16 to 18 speed, compared with 30 percent of the general population. However, teen speeding is more common for certain groups, in certain locations, and with certain driving behaviors.
By Sex
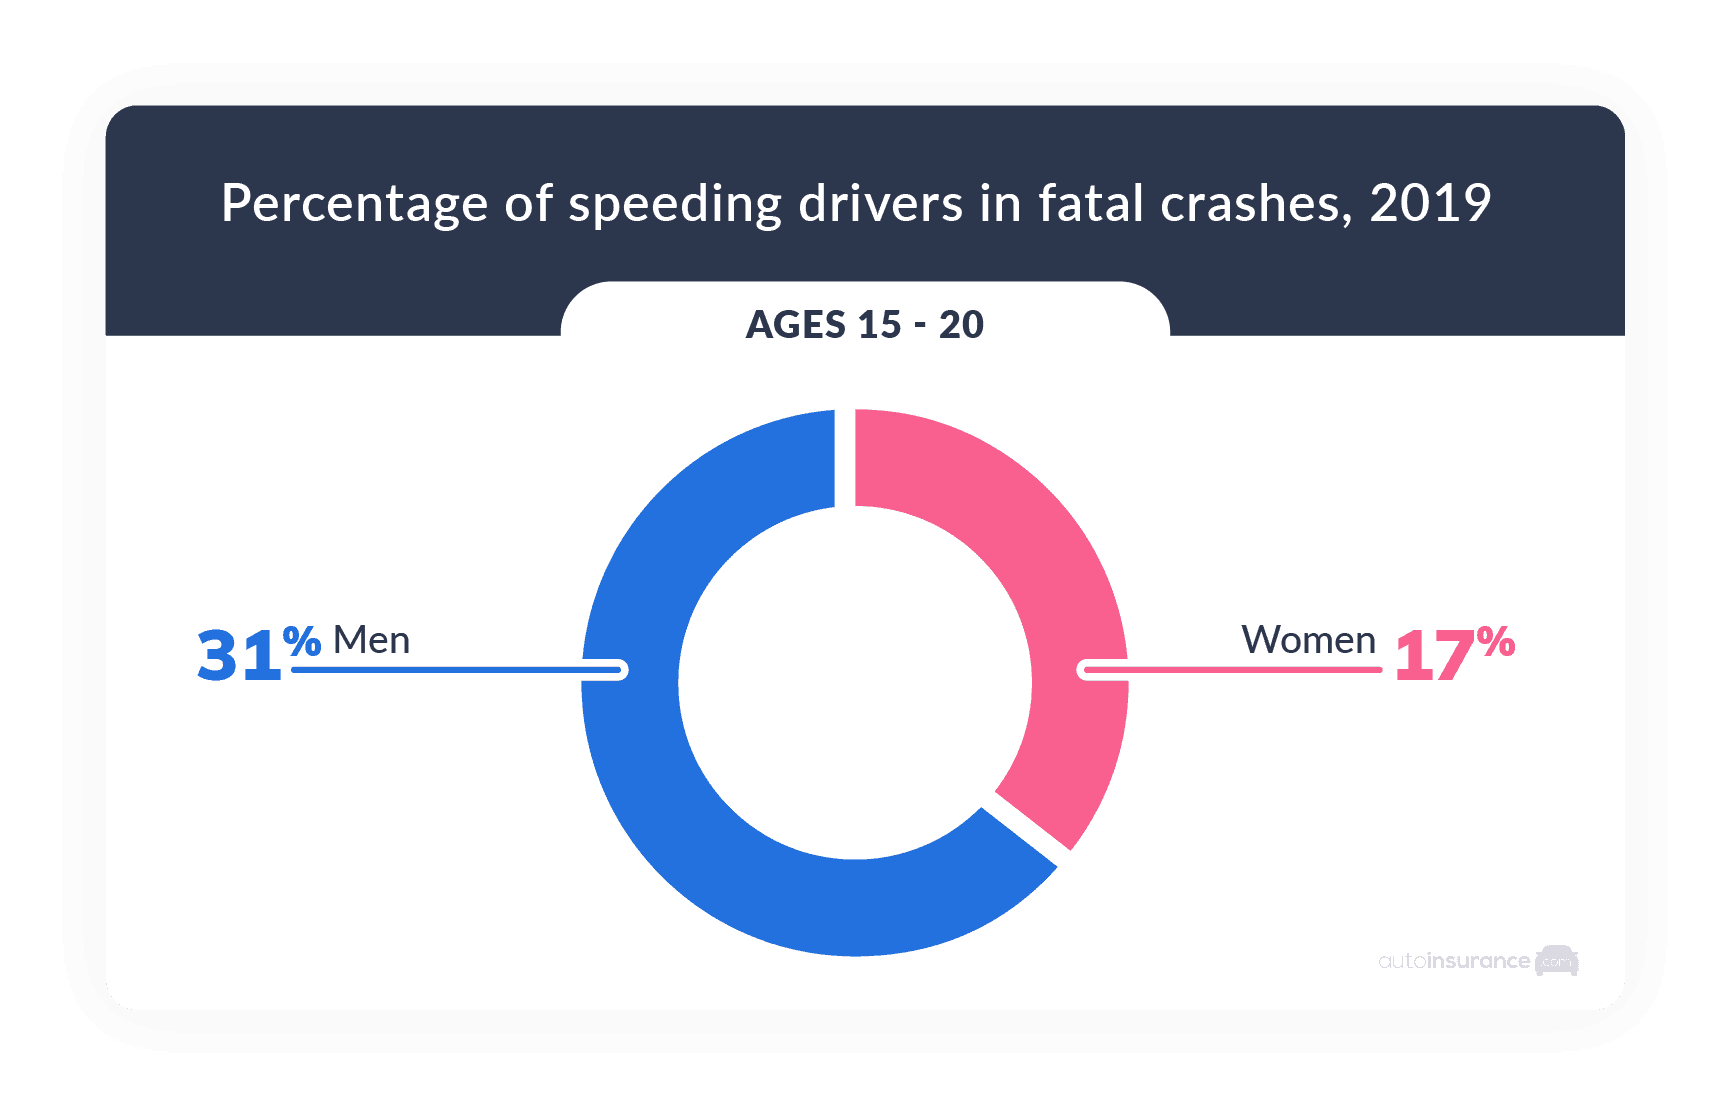
Male teens are more likely to die in speeding accidents than female teens by a difference of 45 percent. This isn’t surprising, as men pay more for car insurance in most states because of their higher propensity for speeding and at-fault accidents.
| Sex of drivers age 15-20 | Percentage of speeding drivers in fatal crashes in 2019 |
|---|---|
| Male | 31% |
| Female | 17% |
By State
Some states have more traffic fatalities related to teen speeding than others. Hawaii has the most: 83 percent of all its teen motor vehicle deaths from 2015 to 2019 were related to speeding. Speeding caused the majority of teen motor vehicle deaths for 20 states, and half of them for four states.
| State | Fatalities related to teen driver speeding in 2015-19 (high to low) |
|---|---|
| Hawaii | 83% |
| Washington D.C. | 80% |
| New Hampshire | 77% |
| Maine | 71% |
| Pennsylvania | 68% |
| Rhode Island | 67% |
| New York | 63% |
| Missouri | 61% |
| Illinois | 59% |
| New Mexico | 58% |
| Colorado | 57% |
| Oregon | 57% |
| South Carolina | 57% |
| Vermont | 56% |
| Wyoming | 55% |
| Connecticut | 54% |
| Massachusetts | 54% |
| Kansas | 53% |
| Arizona | 51% |
| Nevada | 51% |
| Alaska | 50% |
| Delaware | 50% |
| Maryland | 50% |
| New Jersey | 50% |
| North Carolina | 49% |
| Virginia | 49% |
| West Virginia | 47% |
| California | 46% |
| South Dakota | 46% |
| Wisconsin | 46% |
| Michigan | 44% |
| Montana | 44% |
| Texas | 44% |
| Washington | 44% |
| Indiana | 40% |
| Alabama | 39% |
| Oklahoma | 39% |
| North Dakota | 38% |
| Minnesota | 36% |
| Ohio | 36% |
| Arkansas | 34% |
| Utah | 34% |
| Kentucky | 33% |
| Louisiana | 32% |
| Georgia | 28% |
| Iowa | 28% |
| Tennessee | 27% |
| Idaho | 26% |
| Nebraska | 23% |
| Florida | 21% |
| Mississippi | 20% |
Mississippi has the lowest rate: In this state, only 1 in 5 teen traffic fatalities are related to speeding.

By Alcohol Use
Only about 3 in 10 speeding-related fatal crashes for teens involve alcohol, which is the lowest percentage for any age group except 75 and older. However, we know that teen drivers have the highest crash rates of any age group, which implies that most of their crashes are not due to driving under the influence, but inexperience.
| Ages of speeding drivers involved in fatal crashes in 2020 | No alcohol use | BAC over 0.08% |
|---|---|---|
| 15-20 | 69% | 25% |
| 21-24 | 55% | 40% |
| 25-34 | 52% | 42% |
| 35-44 | 52% | 42% |
| 45-54 | 54% | 41% |
| 55-64 | 61% | 33% |
| 65-74 | 68% | 29% |
| 75 and older | 87% | 10%2 |

Find out if you’re overpaying for auto insurance.
See how much you could be saving! Let’s get started by entering your ZIP Code.
Parent Attitudes on Teen Speeding
Teens are slightly more confident than parents about their ability to control speed.
| Parents “moderately” or “extremely” confident in their teens’ speed control | Teens “moderately” or “extremely” confident in their own speed control |
|---|---|
| 67% | 72% |
According to our survey, 78 percent of parents are “slightly” to “extremely” concerned about teen driver speeding, while 1 in 5 aren’t concerned at all.
| Parents’ concern level about teen drivers’ speeding | Percentage of responses |
|---|---|
| Not at all concerned | 22% |
| Slightly or somewhat concerned | 61% |
| Moderately or extremely concerned | 17% |
Why Is Speeding So Dangerous for Teens?
While speeding is dangerous for everyone, it’s worse for teens, because they have little driving experience and typically can’t react quickly to dangerous situations.
Characteristics of Teen Speeding
Roadway Departures vs. Rollovers
Teens are slightly more likely than the average across all age groups to crash fatally in roadway departures as opposed to rollovers. Nearly 7 in 10 speeding-related motor vehicle deaths of teens from 2015 to 2019 involved roadway departures.

| Ages of drivers in speeding-related fatal crashes in 2015-19 | Percentage of crashes involving roadway departure | Percentage of crashes involving rollover |
|---|---|---|
| 16 | 71% | 41% |
| 17 | 71% | 35% |
| 18 | 68% | 37% |
| 19 | 65% | 33% |
| 20-29 | 62% | 33% |
| 30-39 | 58% | 32% |
| 40-49 | 55% | 30% |
| 50 and older | 52% | 26% |
Seat Belt Use
On average, 46 percent of teen speeding crashes involved young drivers not wearing seat belts.
| Age | Percentage of fatally injured teen drivers in speeding-related crashes who were unrestrained |
|---|---|
| 16 | 43% |
| 17 | 47% |
| 18 | 46% |
| 19 | 47% |
While most teens wear seat belts every time they drive, 16 percent do not, making injuries and fatalities more likely for them in crashes.
| How often do teen drivers wear their seat belts, compared to how often their parents think they do? | Percentage of parents’ responses | Percentage of teens’ responses |
|---|---|---|
| Every time | 78% | 83% |
| Almost every time | 18% | 8% |
| Sometimes | 3% | 4% |
| Never or almost never | 1% | 4% |
Road Type
Most fatal crashes of teens that involve speeding occur on non-freeway arterial roads, at an average of 44 percent for 2015 to 2019. Specifically, 16- and 17-year-olds were most likely to die on collector or local roads.
| Age of drivers in speeding-related fatal crashes in 2015-19 | Freeway | Non-freeway arterial road | Collector/local road |
|---|---|---|---|
| 16 | 5% | 39% | 54% |
| 17 | 9% | 41% | 50% |
| 18 | 14% | 46% | 40% |
| 19 | 16% | 47% | 37% |
| 20 and older | 22% | 48% | 29%3 |
If you want to protect your teen driver and their passengers, consider drawing up a parent-teen driving agreement for each of you to sign, or enroll them in driving school.
Methodology
We conducted two surveys: one of parents and one of teen drivers ages 16 to 18.
The parent survey questioned 243 parents of teens ages 13 to 19 on SurveyMonkey from April 26 to May 3, 2022. Here are the ages of the respondents’ children by percentage:
| How old is/are your teenage child or children? Select all that apply. | Responses |
|---|---|
| 13 | 10% |
| 14 | 17% |
| 15 | 9% |
| 16 | 32% |
| 17 | 41% |
| 18 | 29% |
| 19 | 15% |
We ran the teen survey via Pollfish on April 26 and 27, 2022. We received 250 responses from males (48 percent) and females (52 percent) ages 16 through 18.
We supplemented our original data with third-party research from these national organizations:
- Governors Highway Safety Association
- National Highway Traffic Safety Administration
- National Institutes of Health
- National Safety Council
Frequently Asked Questions
According to 2020 data from the National Safety Council, the age group of drivers that crashes the most is 16 to 19. They have the highest rate of all types of crashes, and of motor vehicle deaths due to crashes.
| Age group | 2020 rate of motor vehicle deaths per 100,000 licensed drivers | 2020 rate of all motor vehicle crashes per 100,000 licensed drivers |
|---|---|---|
| 16-19 | 44 | 22,103 |
| 20-24 | 39 | 15,876 |
| 25-34 | 34 | 11,941 |
| 35-44 | 26 | 9,062 |
| 45-54 | 23 | 7,776 |
| 55-64 | 20 | 6,187 |
| 65-74 | 14 | 4,383 |
| 75 and older | 24 | 3,369 |
- Speeding
- Distracted driving (texting, eating, talking with passengers, and any other type of multitasking)
- Driving under the influence
- Drowsy driving
- Driving at night
- Driving in bad weather
- Driving in bad road conditions
As of 2020, the leading cause of death among teenagers (ages 13 to 19) in the United States is unintentional injuries from accidents, including car crashes. The death rate is 17 per 100,000 teenagers, according to data from the Centers for Disease Control and Prevention.
Are teenage girls or boys better drivers?
According to the Insurance Institute for Highway Safety from 2019, teenage girls are better drivers than teenage boys. Male teens are 13 percent more likely to be involved in crashes than female teens.
| Age group | Males involved in crashes in 2019 | Females involved in crashes in 2019 |
|---|---|---|
| 16-20 | 11,990 | 10,432 |
Citations
The observed effects of teenage passengers on the risky driving behavior of teenage drivers. ScienceDirect. (2005, April 14).
https://www.sciencedirect.com/science/article/abs/pii/.Speeding. NSC Injury Facts. (2022).
https://injuryfacts.nsc.org/motor-vehicle/motor-vehicle-safety-issues/speeding/.Teens and Speeding Breaking. GHSA. (2021, February 16).
https://www.ghsa.org/sites/default/files/2021-02/GHSA_TeenSpeeding_Feb16.pdf.
Related Articles

Guide to Teen Driving Laws by State
June 18, 2026
Car Crash Statistics 2026
March 27, 2026
Guide to Parent-Teen Driving Contracts
June 25, 2025