Last updated: March 30, 2026
Commuting in the U.S. Facts and Statistics
77 percent of workers in the U.S. drive to work, resulting in average commute times of 26 minutes.
Get quotes from providers in your area

The COVID-19 pandemic had a huge impact on commutes in the United States, though the majority of Americans still commute in some way. From October of 2022 to June of 2024, the number of remote workers in the United States went from 17 to 22 percent. As for the commuters using public transportation, the percentage decreased and 5 percent of workers in 2022 to 3 percent in 2022.

America’s commute uncovered—State Farm knows the road ahead.
Discover what gets drivers moving daily and how to stay protected on every trip.
How long is the average American commute time?
The average American has a 26-minute commute, even with the trend of people working from home. We analyzed data from the U.S. Census and other sources to determine the state of commuting in 2024. That being said, most of the data available is from 2022 or before.
Editor’s note (last updated April 28, 2025): We have updated this page with the most recent data from the U.S. Census Bureau as well as other third-party organizations.
Key findings:
- On average, Americans had a one-way commute time of 26 minutes in 2022.
- Residents of New York state had the longest commute times, on average, of 33 minutes one-way. Residents of Wyoming, South Dakota, and North Dakota, on the other hand, had the lowest average commute times of only 18 minutes each.
- 77 percent of U.S. commuters drive to work, while only 3 percent take public transportation.
- After a 28-minute peak in 2019, average commute times in 2022 are back down to 2015 levels.
Average Commute Time
In 2022, the most recent year that the U.S. Census collected data, the average commute time for American workers was 26 minutes. However, for more than half of workers, their commutes were between 10 and 29 minutes long, a reasonable amount of time to be trapped in a car, bus or train, among other modes of transportation (more on that below).1
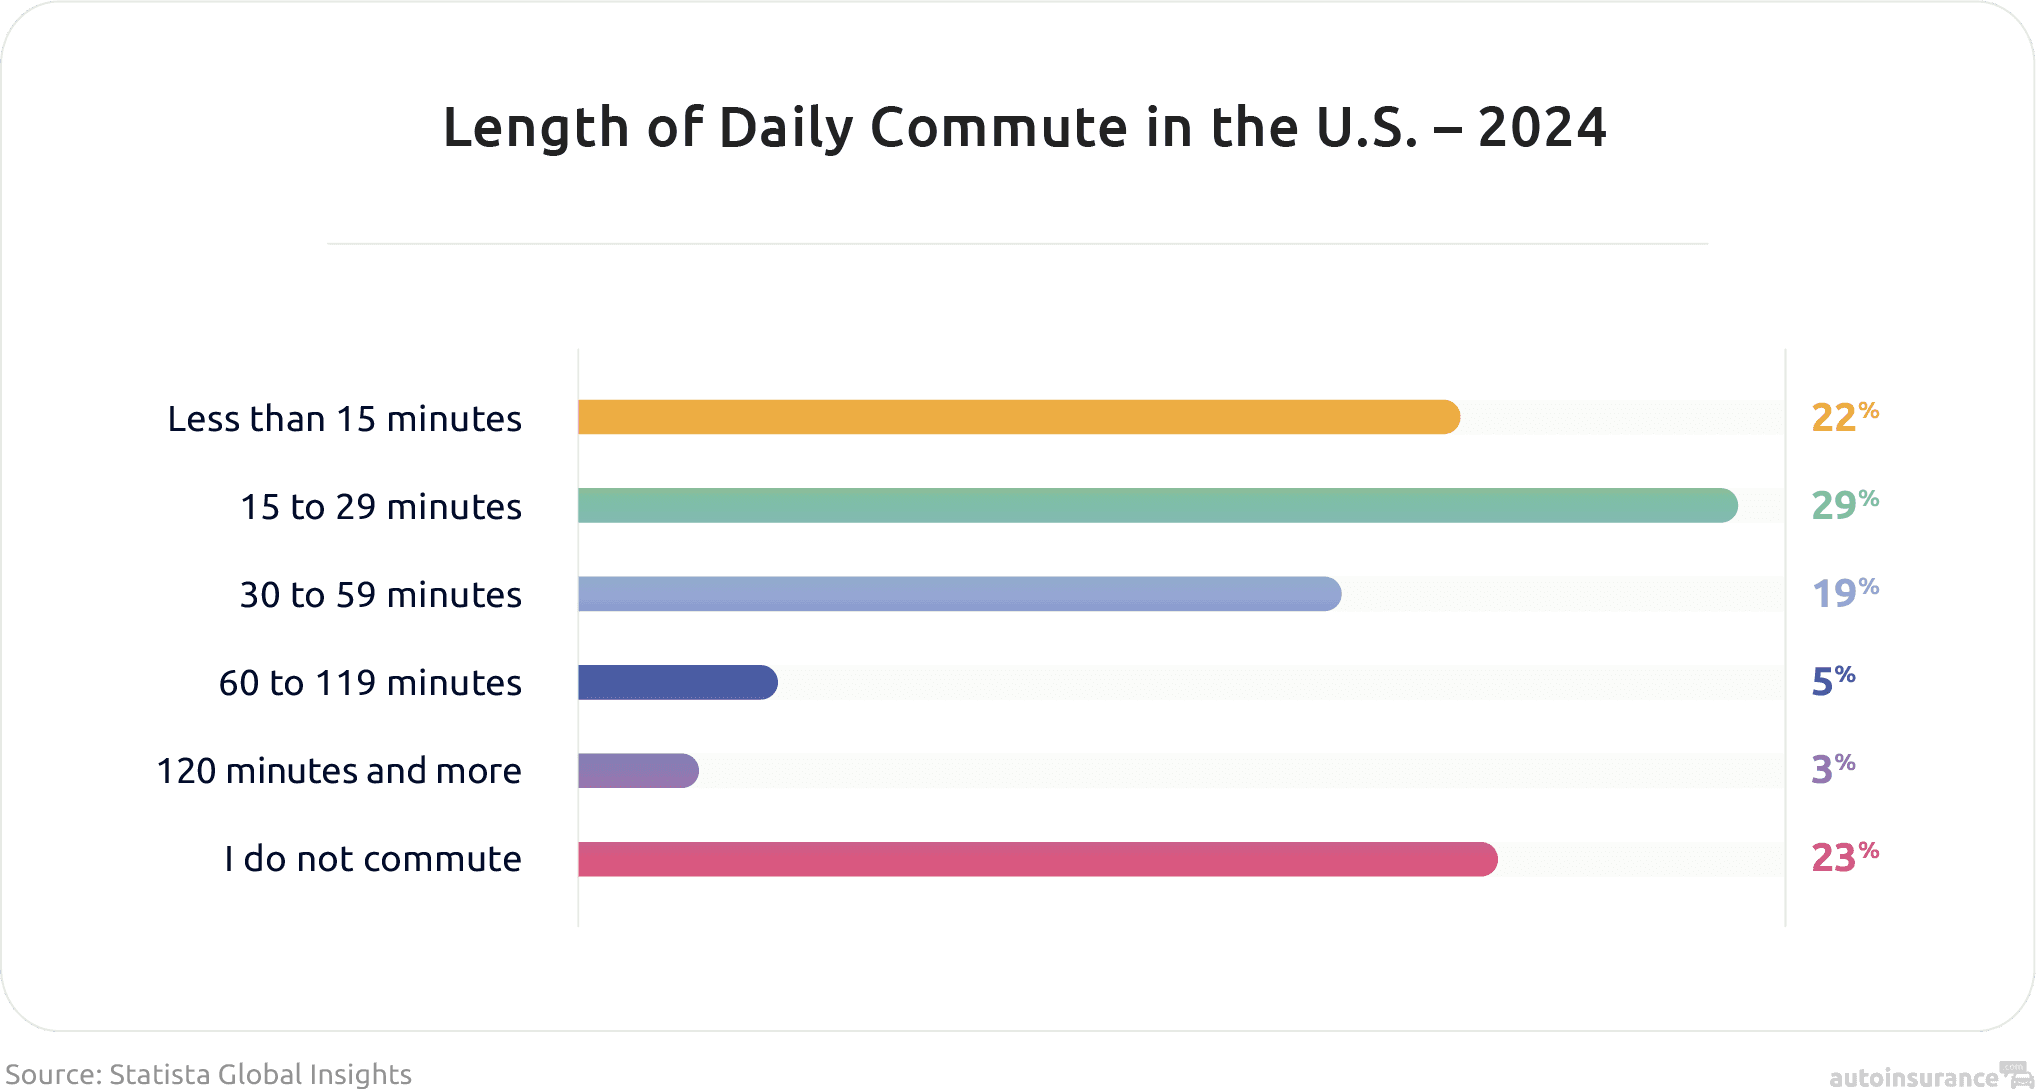
March 2024 data from Statista Consumer Insights Global shows that, for the plurality of U.S. commuters, it takes 16 to 29 minutes to get to work, school, or university. Over half of commuters have commutes less than 30 minutes long.2
By State
The most recent 2022 U.S. Census data tell us that the state with the longest travel time to work was New York, which had a mean commute time of 33 minutes. Wyoming, South Dakota, and North Dakota tied for the lowest mean commute time of only 18 minutes, on the other hand.

| State | Mean travel time to work (minutes), 2022 |
|---|---|
| Alabama | 25 |
| Alaska | 19 |
| Arizona | 25 |
| Arkansas | 22 |
| California | 28 |
| Colorado | 25 |
| Connecticut | 27 |
| Delaware | 26 |
| District of Columbia | 30 |
| Florida | 28 |
| Georgia | 28 |
| Hawaii | 26 |
| Idaho | 22 |
| Illinois | 28 |
| Indiana | 24 |
| Iowa | 20 |
| Kansas | 20 |
| Kentucky | 24 |
| Louisiana | 26 |
| Maine | 25 |
| Maryland | 31 |
| Massachusetts | 29 |
| Michigan | 24 |
| Minnesota | 23 |
| Mississippi | 26 |
| Missouri | 24 |
| Montana | 19 |
| Nebraska | 19 |
| Nevada | 25 |
| New Hampshire | 27 |
| New Jersey | 30 |
| New Mexico | 24 |
| New York | 33 |
| North Carolina | 25 |
| North Dakota | 18 |
| Ohio | 24 |
| Oklahoma | 23 |
| Oregon | 23 |
| Pennsylvania | 26 |
| Rhode Island | 25 |
| South Carolina | 26 |
| South Dakota | 18 |
| Tennessee | 26 |
| Texas | 27 |
| Utah | 22 |
| Vermont | 23 |
| Virginia | 27 |
| Washington | 26 |
| West Virginia | 27 |
| Wisconsin | 22 |
| Wyoming | 18 |
By City
As New York has the longest commute times of any state, it’s not surprising that New York City has the longest commute of any metropolitan statistical area (MSA) with populations of at least 1 million people. NYC residents spent an average of 38 minutes commuting in 2019 (2022 estimates are unavailable for MSAs).
Another New York city, albeit one with a decidedly smaller population than NYC, had the shortest commute of any MSA: Rochester. Rochesterians spent just over 20 minutes commuting in 2019.
| MSA name (populations for at least 1 million) | Average
travel time in minutes in 2019 |
|---|---|
| New York-Newark-Jersey City, NY-NJ-PA | 38 |
| Washington-Arlington-Alexandria, DC-VA-MD-WV | 36 |
| San Francisco-Oakland-Berkeley, CA | 35 |
| Riverside-San Bernardino, CA | 34 |
| Boston-Cambridge-Newton, MA-NH | 33 |
| Atlanta-Sandy Springs-Alpharetta, GA | 33 |
| Chicago-Naperville-Elgin, IL-IN-WI | 32 |
| Baltimore-Columbia-Towson, MD | 32 |
| Los Angeles-Long Beach-Anaheim, CA | 32 |
| Seattle-Tacoma-Bellevue, WA | 32 |
| Philadelphia-Camden-Wilmington, PA-NJ-DE-MD | 31 |
| Houston-The Woodlands-Sugar Land, TX | 31 |
| Miami-Fort Lauderdale-Pompano Beach, FL | 30 |
| San Jose-Sunnyvale-Santa Clara, CA | 30 |
| Orlando-Kissimmee-Sanford, FL | 30 |
| Denver-Aurora-Lakewood, CO | 29 |
| Dallas-Fort Worth-Arlington, TX | 29 |
| Nashville-Davidson–Murfreesboro–Franklin, TN | 29 |
| Tampa-St. Petersburg-Clearwater, FL | 28 |
| Sacramento-Roseville-Folsom, CA | 28 |
| Birmingham-Hoover, AL | 28 |
| Phoenix-Mesa-Chandler, AZ | 28 |
| Austin-Round Rock-Georgetown, TX | 28 |
| Charlotte-Concord-Gastonia, NC-SC | 28 |
| Pittsburgh, PA | 28 |
| Detroit-Warren-Dearborn, MI | 28 |
| Raleigh-Cary, NC | 27 |
| San Antonio-New Braunfels, TX | 27 |
| Jacksonville, FL | 27 |
| Providence-Warwick, RI-MA | 27 |
| San Diego-Chula Vista-Carlsbad, CA | 27 |
| Portland-Vancouver-Hillsboro, OR-WA | 27 |
| New Orleans-Metairie, LA | 27 |
| Minneapolis-St. Paul-Bloomington, MN-WI | 26 |
| St. Louis, MO | 26 |
| Las Vegas-Henderson-Paradise, NV | 26 |
| Richmond, VA | 26 |
| Cincinnati, OH-KY-IN | 26 |
| Indianapolis-Carmel-Anderson, IN | 26 |
| Tucson, AZ | 25 |
| Columbus, OH | 25 |
| Cleveland-Elyria, OH | 25 |
| Memphis, TN-MS-AR | 25 |
| Virginia Beach-Norfolk-Newport News, VA-NC | 25 |
| Hartford-East Hartford-Middletown, CT | 24 |
| Louisville/Jefferson County, KY-IN | 24 |
| Kansas City, MO-KS | 24 |
| Oklahoma City, OK | 24 |
| Milwaukee-Waukesha, WI | 24 |
| Salt Lake City, UT | 23 |
| Grand Rapids-Kentwood, MI | 22 |
| Buffalo-Niagara Falls, NY | 22 |
| Rochester, NY | 21 |
By Mode of Transportation
Biking took 71 minutes for the average commuter in 2019, while the average travel time by bus was just 13 minutes.
Interestingly, carpooling took less time on average than driving alone — by 2 minutes. Not to mention, time usually feels like it’s flying by when you’re enjoying a ride with your colleagues.

Commuting Over the Years
After peaking in 2019 with average commute times of 28 minutes, the average commute time in the U.S. was 26 minutes, up one minute from 2021. What do Americans do with this extra time they gain by having shorter commutes? We’ll explore this further down.
| Year | Travel time in minutes | Year over year difference |
|---|---|---|
| 2006 | 25 | n/a |
| 2007 | 25 | 0% |
| 2008 | 25 | 0% |
| 2009 | 25 | 0% |
| 2010 | 25 | 0% |
| 2011 | 25 | 0% |
| 2012 | 26 | 4% |
| 2013 | 26 | 0% |
| 2014 | 26 | 0% |
| 2015 | 26 | 0% |
| 2016 | 27 | 4% |
| 2017 | 27 | 0% |
| 2018 | 27 | 0% |
| 2019 | 28 | 4% |
| 2020 | Not available | n/a |
| 2021 | 25 | -11% |
| 2022 | 26 | 4% |
Remote and Hybrid Work in a Post-Pandemic World
Aside from devastating the health and lives of millions worldwide, one of COVID-19’s largest effects was on the way people work. In 2019, 6 percent of U.S. workers ages 16 and older worked from home. After peaking at 18 percent in 2021, remote work rates have decreased to 15 percent in 2022. More people are returning to in-person work, and according to February 2023 data from the Pew Research Center (PRC), 59 percent of U.S. workers are extremely or highly satisfied with their commutes.3
Many people who can do their jobs from home go into the office at least some of the time. The same PRC survey found that, of employed U.S. adults with “teleworkable” jobs, only 35 percent work at home all of the time. A year earlier, that percentage was 43 percent, meaning that even for employees who could do their jobs from home, only about a third actually take advantage of that all the time. 71 percent of workers say that remote work helps them balance their work and personal lives. The survey did not ask the respondents about gas savings, but presumably, many of them could also benefit from pay-per-mile insurance.
Worldwide, 28 percent of workers work from home all or most of the time, a number that has been increasing since 2015, according to PayScale.4
| Year | Percentage of employees who work from home all or most of the time worldwide from 2015 to 2023 |
|---|---|
| 2015 | 7% |
| 2016 | 8% |
| 2017 | 9% |
| 2018 | 9% |
| 2019 | 10% |
| 2020 | 13% |
| 2021 | 20% |
| 2022 | 27% |
| 2023 | 28% |
While remote work has peaked in the U.S., it’s still on the rise globally.
The Most Common Commuting Modes
Although public transportation is a more environmentally friendly option than driving alone, many places in the U.S. aren’t well-equipped with the necessary infrastructure. As a result, the majority of Americans — an estimated 69 percent in 2022 — drive to work solo. Now, that’s down significantly from 2020 estimates of 84 percent, but it’s not because more people are taking public transit (it’s the opposite, in fact).
| Mode of transportation | 2019 | 2020 | 2021 | 2022 |
|---|---|---|---|---|
| Car, truck or van | 85% | 84% | 76% | 77% |
| Drove alone | 76% | 75% | 68% | 69% |
| Carpooled | 9% | 9% | 8% | 9% |
| 2-person carpool | Not listed | 7% | 6% | 6% |
| 3-person carpool | Not listed | 1% | 1% | 1% |
| 4-or-more person carpool | Not listed | 1% | 1% | 1% |
| Public transportation (excluding taxicab) | 5% | 5% | 3% | 3% |
| Walked | 3% | 3% | 2% | 2% |
| Bicycle | 1.00% | 1% | Less than 1% | 1% |
| Taxicab, motorcycle or other means | 1% | 1% | 2% | 2% |
| Worked from home | 6% | 7% | 18% | 15% |
The reason for the decrease in car commutes between 2019 and 2021 is due to the increase in people working from home; more on that below.
By State
Residents of which state drive to work the most? The answer is Mississippi, where more than nine out of 10 people drive to work, the majority of them alone. Aside from Washington, D.C., where over a third of all workers are remote, New York has the lowest car commuting rates — only 56 percent.
| Means of transportation to work, 2022 | Car, truck, or van | Drove alone | Carpooled | In 2-person carpool | In 3-person carpool | In 4-or-more person carpool | Public transportation (excluding taxicab) | Walked | Bicycle | Taxicab, motorcycle, or other means | Worked from home |
|---|---|---|---|---|---|---|---|---|---|---|---|
| Alabama | 89% | 81% | 8% | 6% | 1% | 1% | 0% | 1% | 0% | 1% | 9% |
| Alaska | 77% | 64% | 12% | 9% | 2% | 1% | 1% | 7% | 0% | 5% | 10% |
| Arizona | 76% | 66% | 10% | 7% | 2% | 1% | 1% | 2% | 1% | 2% | 19% |
| Arkansas | 88% | 80% | 8% | 6% | 1% | 1% | 0% | 2% | 0% | 1% | 9% |
| California | 75% | 66% | 10% | 7% | 2% | 1% | 3% | 2% | 1% | 2% | 17% |
| Colorado | 73% | 65% | 8% | 6% | 1% | 1% | 2% | 3% | 1% | 1% | 21% |
| Connecticut | 77% | 69% | 8% | 6% | 1% | 1% | 3% | 3% | 0% | 1% | 16% |
| Delaware | 80% | 73% | 7% | 5% | 1% | 1% | 1% | 2% | 0% | 1% | 15% |
| District of Columbia | 32% | 28% | 4% | 3% | 0% | 0% | 19% | 10% | 3% | 3% | 34% |
| Florida | 79% | 70% | 9% | 7% | 1% | 1% | 1% | 1% | 1% | 2% | 16% |
| Georgia | 80% | 71% | 9% | 6% | 2% | 1% | 1% | 1% | 0% | 2% | 16% |
| Hawaii | 79% | 64% | 15% | 11% | 2% | 2% | 4% | 5% | 1% | 3% | 10% |
| Idaho | 81% | 72% | 9% | 6% | 2% | 1% | 1% | 3% | 1% | 1% | 13% |
| Illinois | 74% | 66% | 8% | 6% | 1% | 1% | 6% | 3% | 1% | 1% | 16% |
| Indiana | 85% | 76% | 10% | 7% | 1% | 1% | 1% | 2% | 0% | 1% | 11% |
| Iowa | 84% | 76% | 8% | 6% | 1% | 1% | 1% | 3% | 0% | 1% | 11% |
| Kansas | 84% | 75% | 8% | 6% | 1% | 1% | 1% | 2% | 0% | 1% | 12% |
| Kentucky | 86% | 76% | 10% | 8% | 1% | 1% | 1% | 2% | 0% | 1% | 11% |
| Louisiana | 87% | 79% | 9% | 6% | 2% | 1% | 1% | 2% | 0% | 2% | 8% |
| Maine | 78% | 70% | 8% | 7% | 1% | 1% | 1% | 4% | 1% | 1% | 16% |
| Maryland | 73% | 65% | 8% | 6% | 1% | 1% | 4% | 2% | 0% | 2% | 19% |
| Massachusetts | 69% | 62% | 7% | 6% | 1% | 1% | 6% | 4% | 1% | 2% | 18% |
| Michigan | 82% | 74% | 8% | 6% | 1% | 1% | 1% | 2% | 0% | 1% | 14% |
| Minnesota | 77% | 69% | 8% | 6% | 1% | 1% | 2% | 3% | 1% | 1% | 17% |
| Mississippi | 92% | 82% | 10% | 7% | 2% | 1% | 0% | 2% | 0% | 1% | 6% |
| Missouri | 83% | 75% | 8% | 6% | 1% | 1% | 1% | 2% | 0% | 1% | 13% |
| Montana | 80% | 69% | 11% | 8% | 2% | 2% | 1% | 4% | 1% | 1% | 13% |
| Nebraska | 85% | 77% | 9% | 6% | 2% | 1% | 0% | 2% | 0% | 1% | 11% |
| Nevada | 81% | 70% | 11% | 8% | 2% | 1% | 2% | 1% | 0% | 3% | 12% |
| New Hampshire | 79% | 71% | 8% | 6% | 1% | 1% | 0% | 2% | 0% | 1% | 17% |
| New Jersey | 70% | 62% | 8% | 6% | 1% | 1% | 8% | 3% | 0% | 2% | 17% |
| New Mexico | 83% | 73% | 10% | 7% | 2% | 1% | 1% | 2% | 1% | 1% | 12% |
| New York | 56% | 49% | 7% | 5% | 1% | 1% | 22% | 6% | 1% | 2% | 15% |
| North Carolina | 80% | 71% | 9% | 6% | 1% | 1% | 1% | 2% | 0% | 1% | 17% |
| North Dakota | 88% | 79% | 9% | 6% | 2% | 1% | 0% | 3% | 0% | 1% | 8% |
| Ohio | 83% | 75% | 8% | 6% | 1% | 1% | 1% | 2% | 0% | 1% | 13% |
| Oklahoma | 87% | 78% | 9% | 7% | 1% | 1% | 0% | 2% | 0% | 1% | 9% |
| Oregon | 73% | 64% | 9% | 7% | 1% | 1% | 2% | 4% | 1% | 1% | 19% |
| Pennsylvania | 76% | 69% | 8% | 6% | 1% | 1% | 3% | 3% | 1% | 2% | 15% |
| Rhode Island | 80% | 72% | 8% | 6% | 1% | 1% | 1% | 3% | 0% | 2% | 13% |
| South Carolina | 85% | 76% | 9% | 6% | 1% | 1% | 0% | 2% | 0% | 2% | 11% |
| South Dakota | 86% | 79% | 7% | 5% | 1% | 1% | 1% | 3% | 0% | 1% | 10% |
| Tennessee | 84% | 75% | 9% | 7% | 1% | 1% | 0% | 1% | 0% | 1% | 13% |
| Texas | 81% | 71% | 10% | 7% | 2% | 1% | 1% | 2% | 0% | 2% | 15% |
| Utah | 77% | 67% | 10% | 7% | 2% | 1% | 1% | 2% | 1% | 1% | 18% |
| Vermont | 77% | 70% | 7% | 6% | 1% | 1% | 1% | 4% | 1% | 1% | 17% |
| Virginia | 76% | 68% | 8% | 6% | 1% | 1% | 2% | 2% | 0% | 2% | 18% |
| Washington | 72% | 63% | 9% | 7% | 1% | 1% | 3% | 3% | 1% | 1% | 21% |
| West Virginia | 87% | 78% | 8% | 7% | 1% | 1% | 1% | 2% | 0% | 1% | 9% |
| Wisconsin | 82% | 74% | 8% | 6% | 1% | 1% | 1% | 3% | 1% | 1% | 13% |
| Wyoming | 84% | 76% | 8% | 5% | 2% | 1% | 1% | 4% | 1% | 1% | 9% |
In contrast to having the lowest car commuting rate, New York has the highest rate of public transportation commuters (22 percent) of any state. But if you’re part of the 56 percent who drive, you should take advantage of some cheap New York car insurance.
By City
The U.S. Census does not collect MSA-specific information on modes of transportation, only travel time. However, the data does show what percentage of a metropolitan statistical area’s residents take public transportation for their commute, and New York City had the highest amount. About a third of the city’s residents used public transit to commute in 2019, with San Francisco, California, coming in second.
| MSA | Total public transportation commuters in 2019 | Percent
of all workers |
|---|---|---|
| New York-Newark-Jersey City, NY-NJ-PA | 3,000,640 | 32% |
| San Francisco-Oakland-Berkeley, CA | 461,832 | 19% |
| Boston-Cambridge-Newton, MA-NH | 353,924 | 13% |
| Washington-Arlington-Alexandria, DC-VA-MD-WV | 440,972 | 13% |
| Chicago-Naperville-Elgin, IL-IN-WI | 584,804 | 12% |
| Seattle-Tacoma-Bellevue, WA | 224,965 | 11% |
| Bridgeport-Stamford-Norwalk, CT | 49,354 | 11% |
| Philadelphia-Camden-Wilmington, PA-NJ-DE-MD | 282,412 | 9% |
| Urban Honolulu, HI | 35,375 | 7% |
| Portland-Vancouver-Hillsboro, OR-WA | 85,160 | 7% |
| Pittsburgh, PA | 69,104 | 6% |
| Baltimore-Columbia-Towson, MD | 82,685 | 6% |
| Los Angeles-Long Beach-Anaheim, CA | 310,932 | 5% |
| San Jose-Sunnyvale-Santa Clara, CA | 47,745 | 5% |
| Minneapolis-St. Paul-Bloomington, MN-WI | 88,051 | 5% |
| Denver-Aurora-Lakewood, CO | 73,229 | 5% |
| Miami-Fort Lauderdale-Pompano Beach, FL | 88,881 | 3% |
| Las Vegas-Henderson-Paradise, NV | 31,231 | 3% |
| Cleveland-Elyria, OH | 29,006 | 3% |
| Atlanta-Sandy Springs-Alpharetta, GA | 83,142 | 3% |
| San Diego-Chula Vista-Carlsbad, CA | 47,478 | 3% |
| Houston-The Woodlands-Sugar Land, TX | 65,870 | 2% |
| Phoenix-Mesa-Chandler, AZ | 42,925 | 2% |
| Detroit-Warren-Dearborn, MI | 28,450 | 1% |
| Dallas-Fort Worth-Arlington, TX | 48,522 | 1% |
| All other metro areas | 1,022,000 | 1% |
Dallas had the lowest public transportation rates as only 1 percent of the residents used public transportation to commute in 2019, leaving the majority to worry about finding cheap Texas car insurance.
Which Mode is Safest?
Scheduled airlines are the safest way to travel, according to 2022 data from the National Safety Council. That being said, most people don’t take commercial flights to work, and 77 percent of U.S. commuters drive. Unfortunately, passenger vehicles are the most dangerous form of transportation, with 0.54 deaths per 100 million passenger miles.5
| Mode of transportation | Death rate per 100 million passenger miles in 2022 |
|---|---|
| Passenger vehicles | 0.54 |
| Railroad passenger trains | 0.03 |
| Buses | 0.004 |
| Scheduled airlines | 0.001 |
The Effects of Long Commutes
Like most things in life, long commutes have both negative and positive effects. However, it’s fair to say that the negatives outweigh the positives here.
Environmental Impact
It’s clear that long commutes are bad for the environment, particularly if you’re driving (and driving alone is even worse). Driving causes smog, nitrogen oxide and greenhouse gas emissions. The transportation sector contributes 29 percent of greenhouse gas emissions in the U.S. and 22 percent of this is from personal vehicles, according to the Environmental Protection Agency.6
Financial Impact
Long commutes are also expensive, not just for drivers but for the companies that employ them. A study published by the Harvard Business School focused on an inventor firm over a five-year period found that the opportunity cost of commuting may exceed the worker’s hourly wage, meaning workers were spending more to commute than they would make at work during the same time period.
Another factor for drivers is the price of gas. AAA found that, on average, driving gas-powered cars costs 15.93 cents per mile, with an average per gallon cost of $3.99 in 2023. Electric vehicles will also hit your wallet at a rate of 15.8 cents per kilowatt hour.7
Physical Impact
Assuming your commute takes place in a car as it does for the majority of Americans, it could cause negative physical health effects, such as:
- Tightness in hip flexors
- Lower back pain
- Spine damage
- Worse cardiovascular health
- More exposure to pollution
- Less time to exercise
- Difficulty sleeping, which could lead to diabetes/obesity
Mental Health Impact
Long daily commutes can affect your mental health as well as your physical health. They’re known to increase stress, make it less likely you’ll want to drive for social purposes and decrease job satisfaction.8
However, an article published in Harvard Business Review noted some positive effects of commuting on one’s mental health. Commuting is a structured ritual that allows people to separate work from home, share the commuting experience with co-workers and prepare for the day. A drawback of working from home instead of commuting is the lack of separation between work and home life, which can lead to burnout.
Work Impact
Meanwhile, commuting may make people less productive workers. Remember that firm of inventors Harvard Business School studied? It found that commuting had an inverse relationship with productivity.
For every six miles a commute increased, there was a 5 percent decrease in the number of patents developed and a 7 percent decrease in their quality. The effects were even worse for inventors in the top 10 percent of their field.9
While there’s still more research needed on this topic, it’s generally agreed upon that although short commutes can have their benefits, long commutes are bad for the environment and the physical, mental and work health of commuters.
International Commutes
Believe it or not, some people cross country lines to do their jobs. International commuters maintain a permanent residence in their home countries but work abroad on a semi-permanent or permanent basis for two to three years. Often, they travel to their country of work weekly, every other week or every three weeks.
As of July 2024, there are very few studies on international commuters in the U.S. However, the existing research is clear that having commutes this long promotes fatigue, stress and conflict with both work and family. Another finding is that international commuters are most likely to be young, educated males.10 This is one type of commute that most people don’t envy.
Conclusion
Commutes have changed a ton in the past few years, so it’ll be interesting to see what the data for 2025 and beyond say. For more information on transportation in the U.S., read our statistics on car ownership.
Methodology
We used data from the following third parties in this report on commuting in the U.S.:
- Environmental Protection Agency
- Bureau of Transportation Statistics
- Harvard Business School
- Keck Medicine of USC
- Harvard Business Review
- McKinsey
- National Bureau of Economic Research
- PayScale
- Research Handbook of Expatriates
- U.S. Census
Frequently Asked Questions
Based on the 2024 data from the U.S. Census, the average American commute time to work is 26 minutes.
According to 2022 U.S. Census data, 85 percent of U.S. workers commute to work, while only 15 percent work from home.
According to 2022 data from the U.S. Census, the following factors increase commute times:
- Sex: While males and females make up half the population each, men have mean travel times of 28 minutes, while women have mean travel times of 26 minutes.
- Where you live: Your city and state can increase your commute times. For example, the state of New York has the longest average commute time of 33 minutes, while Wyoming, South Dakota, and North Dakota have 18-minute commutes on average. Additionally, particular cities like New York City have longer commutes than cities like Rochester, even though they’re in the same state.
- Percentage of remote workers: The more remote workers in your city, especially a city that depends heavily on motor vehicle transportation, the faster your commute will be.
How long is too long for a daily commute is a personal decision, as there’s no universally ideal commute time. Rather, individuals should assess whether their commutes are too long based on their physical and mental health, along with their job performance. If a commute is impacting your life negatively, it’s too long. That being said, the Bureau of Transportation Statistics defines “stretch commuting” as trips that are at least 50 miles one-way. Similarly, the U.S. Census Bureau defines “extreme commuting” as commutes that are 90 minutes or more, one-way.
Citations
Census Bureau Releases New Brief About Travel to Work Since Pandemic’s Onset. United States Census Bureau. (2024, Feb 20).
https://www.census.gov/newsroom/press-releases/2024/travel-to-work-since-pandemic.htmlDuration of daily commute in the U.S. as of June 2024. Statista. (2024).
https://www.statista.com/forecasts/997116/duration-of-daily-commute-in-the-usHow Americans View Their Jobs. Pew Research. (2023, Mar).
https://www.pewresearch.org/social-trends/2023/03/30/how-americans-view-their-jobs/The state of remote work, return to office policies, and geographic pay strategies in 2023. PayScale. (2023).
https://www.payscale.com/research-and-insights/remote-work/Deaths by Transportation Mode. National Safety Council. (2022).
https://injuryfacts.nsc.org/home-and-community/safety-topics/deaths-by-transportation-mode/Sources of Greenhouse Gas Emissions. United States Environmental Protection Agency. (2024, Jul).
https://www.epa.gov/ghgemissions/sources-greenhouse-gas-emissionsYOUR DRIVING COSTS. AAA. (2023).
https://newsroom.aaa.com/wp-content/uploads/2023/08/YDC-Fact-Sheet-FINAL-8.30.23-1.pdf5 Ways Your Commute Affects Your Health. Keck Medicine of USC. (2019, Jul).
https://www.keckmedicine.org/blog/commuting-and-your-health/Commuting and innovation: Are closer inventors more productive? Journal of Urban Economics. (2019, Feb 17).
https://www.hbs.edu/ris/Publication%20Files/1-s2.0-S0094119020300711-main%20(4)_8b1ae5e2-a615-4908-a5e6-5774884c5f7c.pdfInternational Business Travelers, Short-Term Assignees and International Commuters. ResearchGate. (2017, May).
https://www.researchgate.net/publication/305597604_International_Business_Travelers_Short-Term_Assignees_and_International_Commuters
Related Articles
Auto Insurance Statistics and Facts
March 27, 2026
Car Crash Statistics 2026
March 27, 2026