
Last updated: July 9, 2025
Drunk Driving Statistics
Drunk driving is involved in about one-third of all traffic deaths in the U.S.
Get quotes from providers in your area

According to the National Highway Traffic Safety Administration (NHTSA), 37 people die in drunk driving crashes every day. Alcohol slows your coordination and reaction times, hinders your judgment and blurs your vision, making your driving less than stellar. While the number of drunk drivers in the United States has decreased significantly in the last 40 years, it continues to be a problem.
Learn more about the number of drunk drivers in the U.S., the demographics most at-risk, and the steps you can take to keep yourself and others safe.
How Many People Are Killed by Drunk Drivers? Statistics and Key Takeaways on Drinking and Driving
- 12,429 people were killed by drunk drivers in 2023
- Between 2022 and 2023, drunk driving fatalities in the U.S. decreased by 8 percent. However, drunk driver fatalities are still higher than they were before the pandemic.
- Alcohol was involved in about one-third of road deaths in 2023.
- Adults aged 21 to 24 (in particular men) were the most likely to experience a fatal crash driving while drunk compared to any other age group.
DUI Fatalities by Category
How Many People Die From Alcohol-Related Crashes?
In 2023, the most recent year that the NHTSA published national data, 12,429 people died in drunk driving crashes. One person was killed every 42 minutes due to drunk driving.1
Alcohol-impaired driving is when a driver has a blood alcohol concentration (BAC) of 0.08—the legal limit in most U.S. states—or above. In Utah, the legal limit is a BAC of 0.05.
By Year
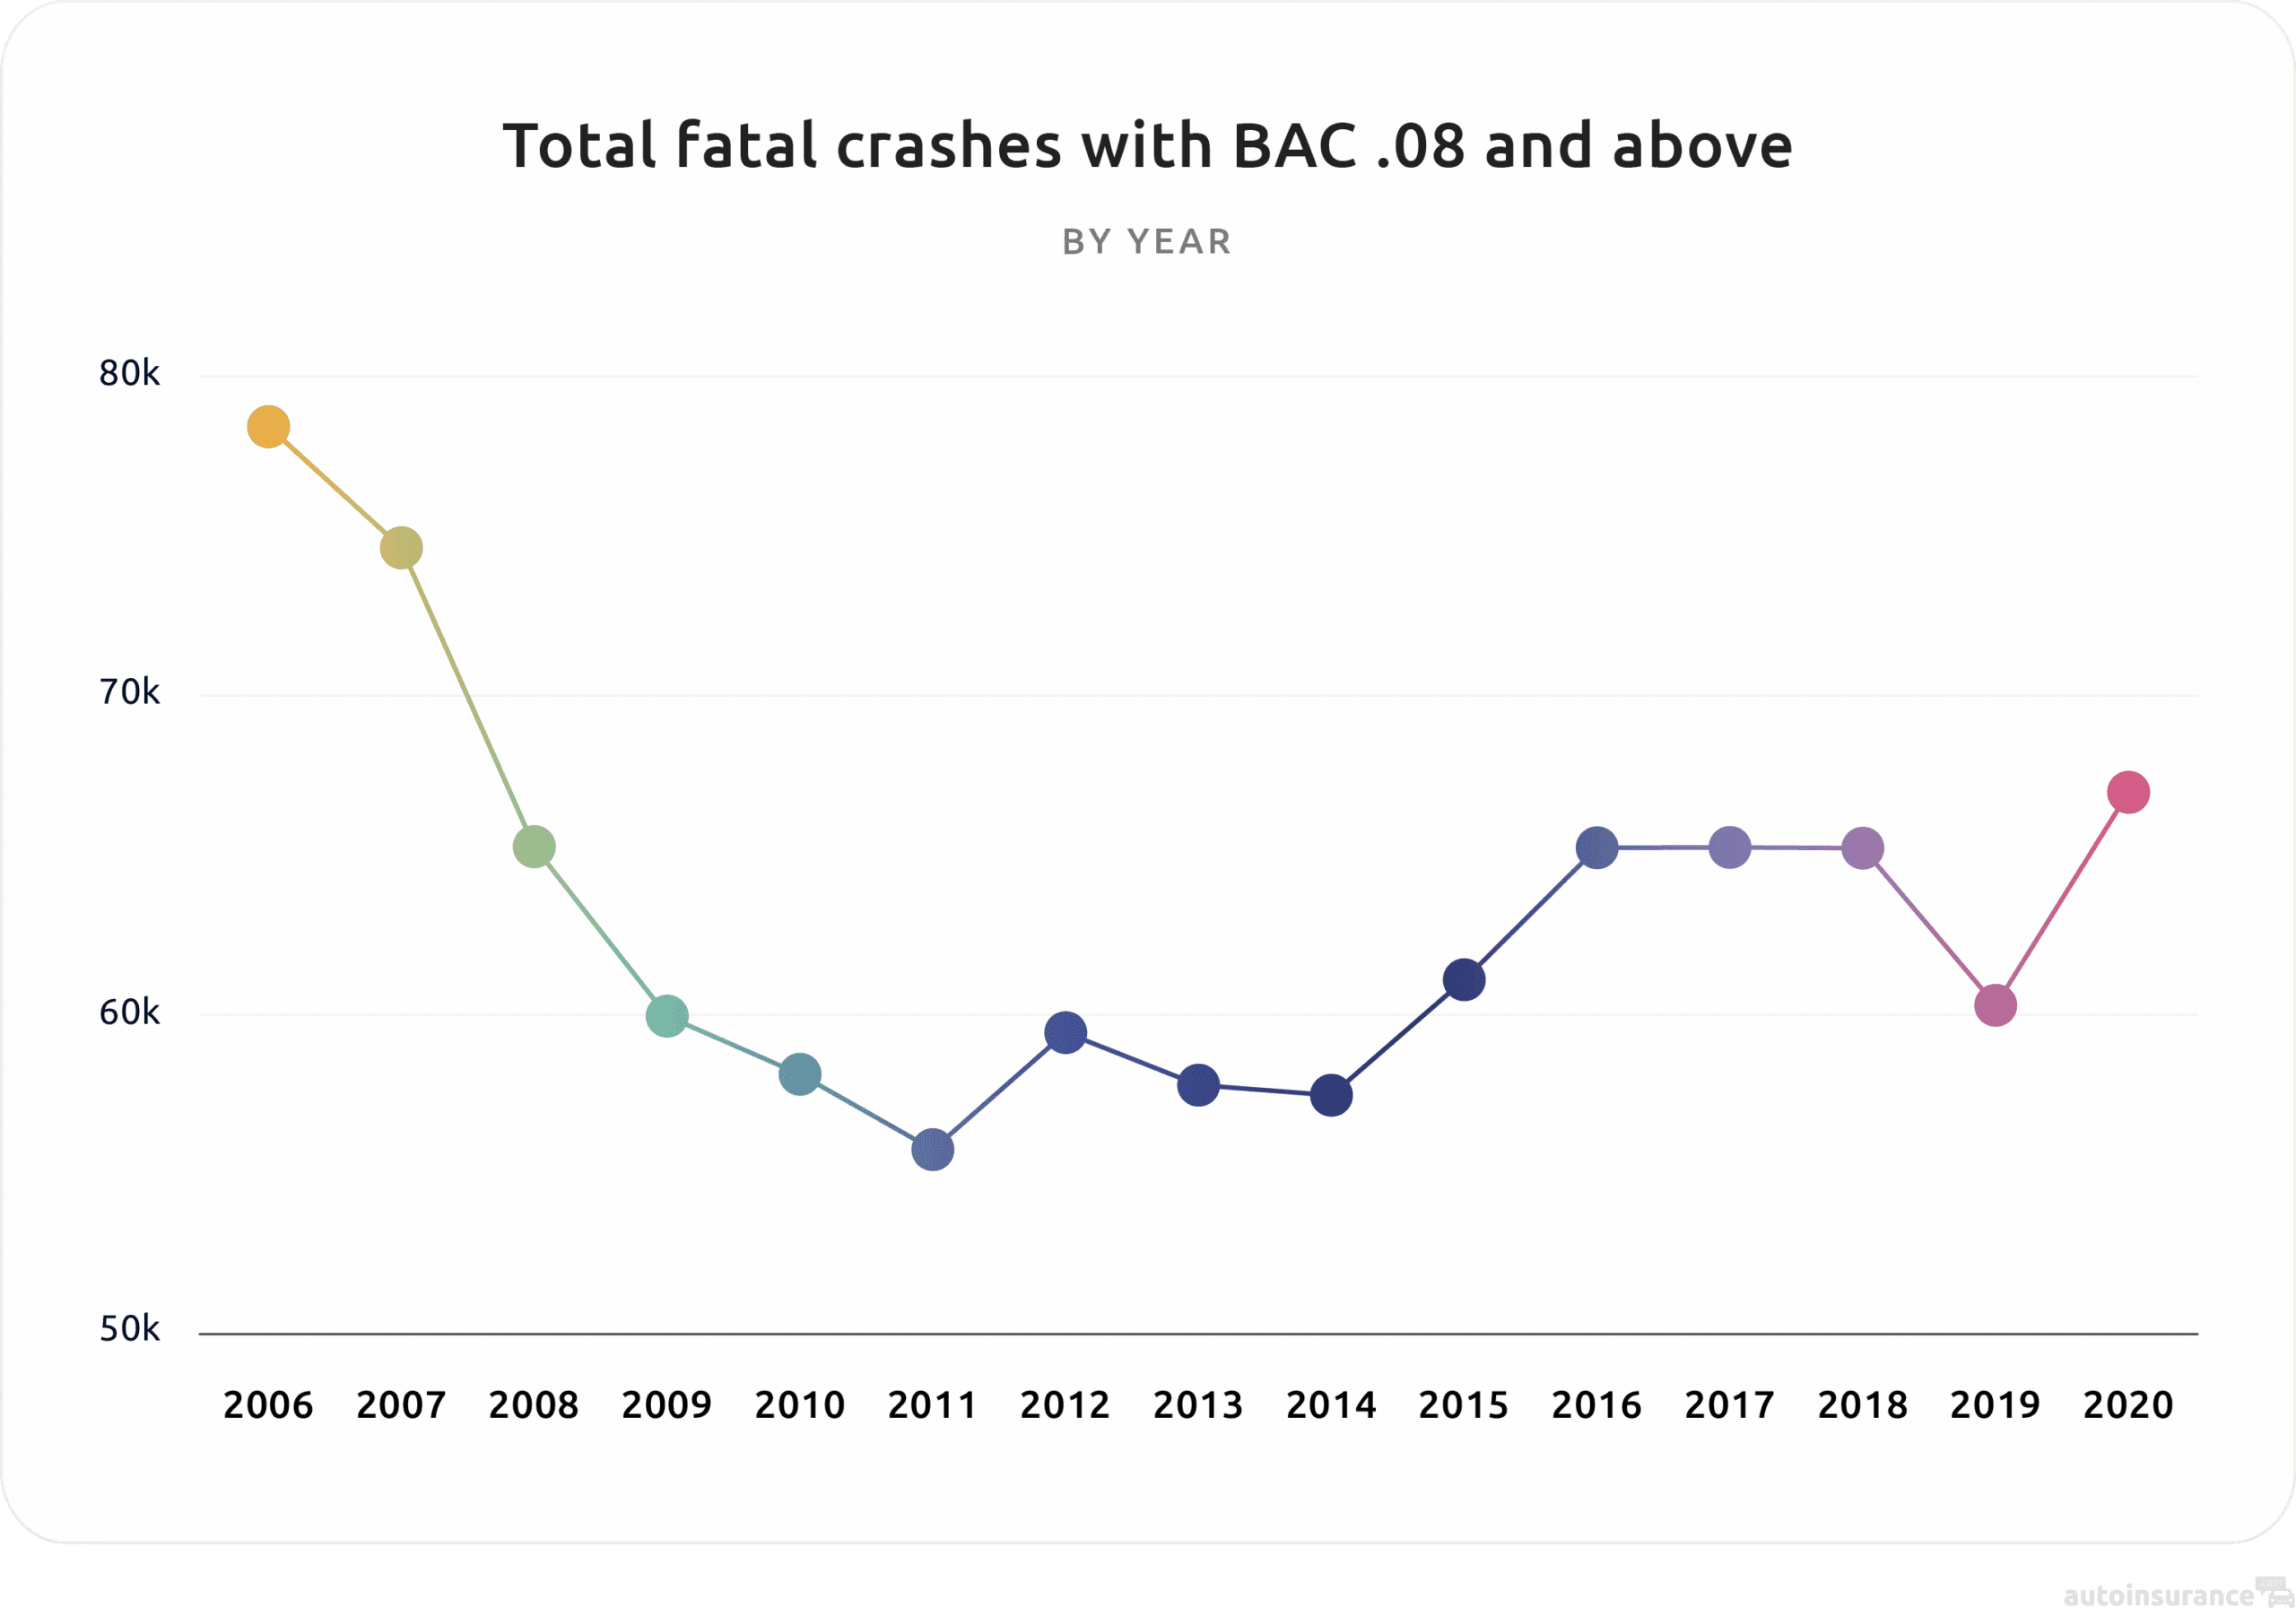
In 2023, the number of people killed in DUIs annually decreased by over 1,000, or about 8 percent. However, DUI deaths increased during the pandemic: between 2019 and 2022, annual deaths increased by about 3,000—or about 33 percent. Still, numbers have improved significantly from 40 years ago. In 1985, 18,125 people were killed in alcohol-impaired crashes, and 41 percent of all crashes involved an alcohol-impaired driver.2
Between 2010 and 2019, the number of people killed in DUIs each year stayed right around 10,000, with an average of 10,268 fatalities each year.

| Year | Alcohol-impaired crash fatalities | Percentage change year to year |
|---|---|---|
| 1985 | 18,125 | N/A |
| 1990 | 17,705 | -2% |
| 1995 | 13,478 | -24% |
| 2000 | 13,324 | -1% |
| 2005 | 13,582 | +2% |
| 2010 | 10,136 | -25% |
| 2011 | 9,865 | -2% |
| 2013 | 10,336 | +4% |
| 2014 | 9,943 | -3% |
| 2015 | 10,280 | +3% |
| 2016 | 10,067 | -2% |
| 2017 | 10,880 | +8% |
| 2018 | 10,710 | -2% |
| 2019 | 10,196 | -4% |
| 2020 | 11,727 | +15% |
| 2021 | 13,617 | +16% |
| 2022 | 13,524 | -0.5% |
| 2023 | 12,429 | -8% |
By State
South Carolina and Rhode Island have the highest percentage of alcohol-related road fatalities, with 43 percent of all fatal crashes involving a driver with a BAC of 0.08 or higher.3 On the other end of the spectrum is Utah—the state with the strictest BAC limit in the country—where only 22 percent of traffic fatalities were alcohol-related. The average across all states is 32 percent, accounting for about a third of all motor vehicle deaths.
Note that the NHTSA records data based on the driver involved with the highest BAC, so if there are two drivers in the crash, one with a BAC of 0.00 (sober) and one with a BAC of 0.09 (drunk), the latter will be recorded and the crash will be considered alcohol-impaired.
| State | Percent of fatal crashes involving a drunk driver |
|---|---|
| South Carolina | 43% |
| Rhode Island | 43% |
| Texas | 42% |
| Oregon | 39% |
| Washington, D.C. | 39% |
| Illinois | 37% |
| Ohio | 37% |
| Maryland | 37% |
| New Hampshire | 36% |
| Arizona | 35% |
| Washington | 35% |
| Connecticut | 35% |
| Colorado | 34% |
| Nevada | 34% |
| Iowa | 34% |
| Montana | 34% |
| Maine | 34% |
| North Dakota | 34% |
| Vermont | 34% |
| California | 33% |
| New Mexico | 33% |
| New York | 32% |
| Idaho | 32% |
| South Dakota | 32% |
| Hawaii | 31% |
| Virginia | 30% |
| Delaware | 30% |
| Wyoming | 30% |
| Pennsylvania | 29% |
| Indiana | 29% |
| Louisiana | 29% |
| Wisconsin | 29% |
| Minnesota | 29% |
| Georgia | 28% |
| North Carolina | 28% |
| Tennessee | 28% |
| Alabama | 28% |
| Massachusetts | 28% |
| Nebraska | 28% |
| Florida | 27% |
| Michigan | 27% |
| Missouri | 27% |
| Kansas | 27% |
| Oklahoma | 26% |
| New Jersey | 26% |
| Kentucky | 24% |
| Mississippi | 24% |
| Arkansas | 24% |
| Alaska | 24% |
| West Virginia | 23% |
| Utah | 22% |
By Age
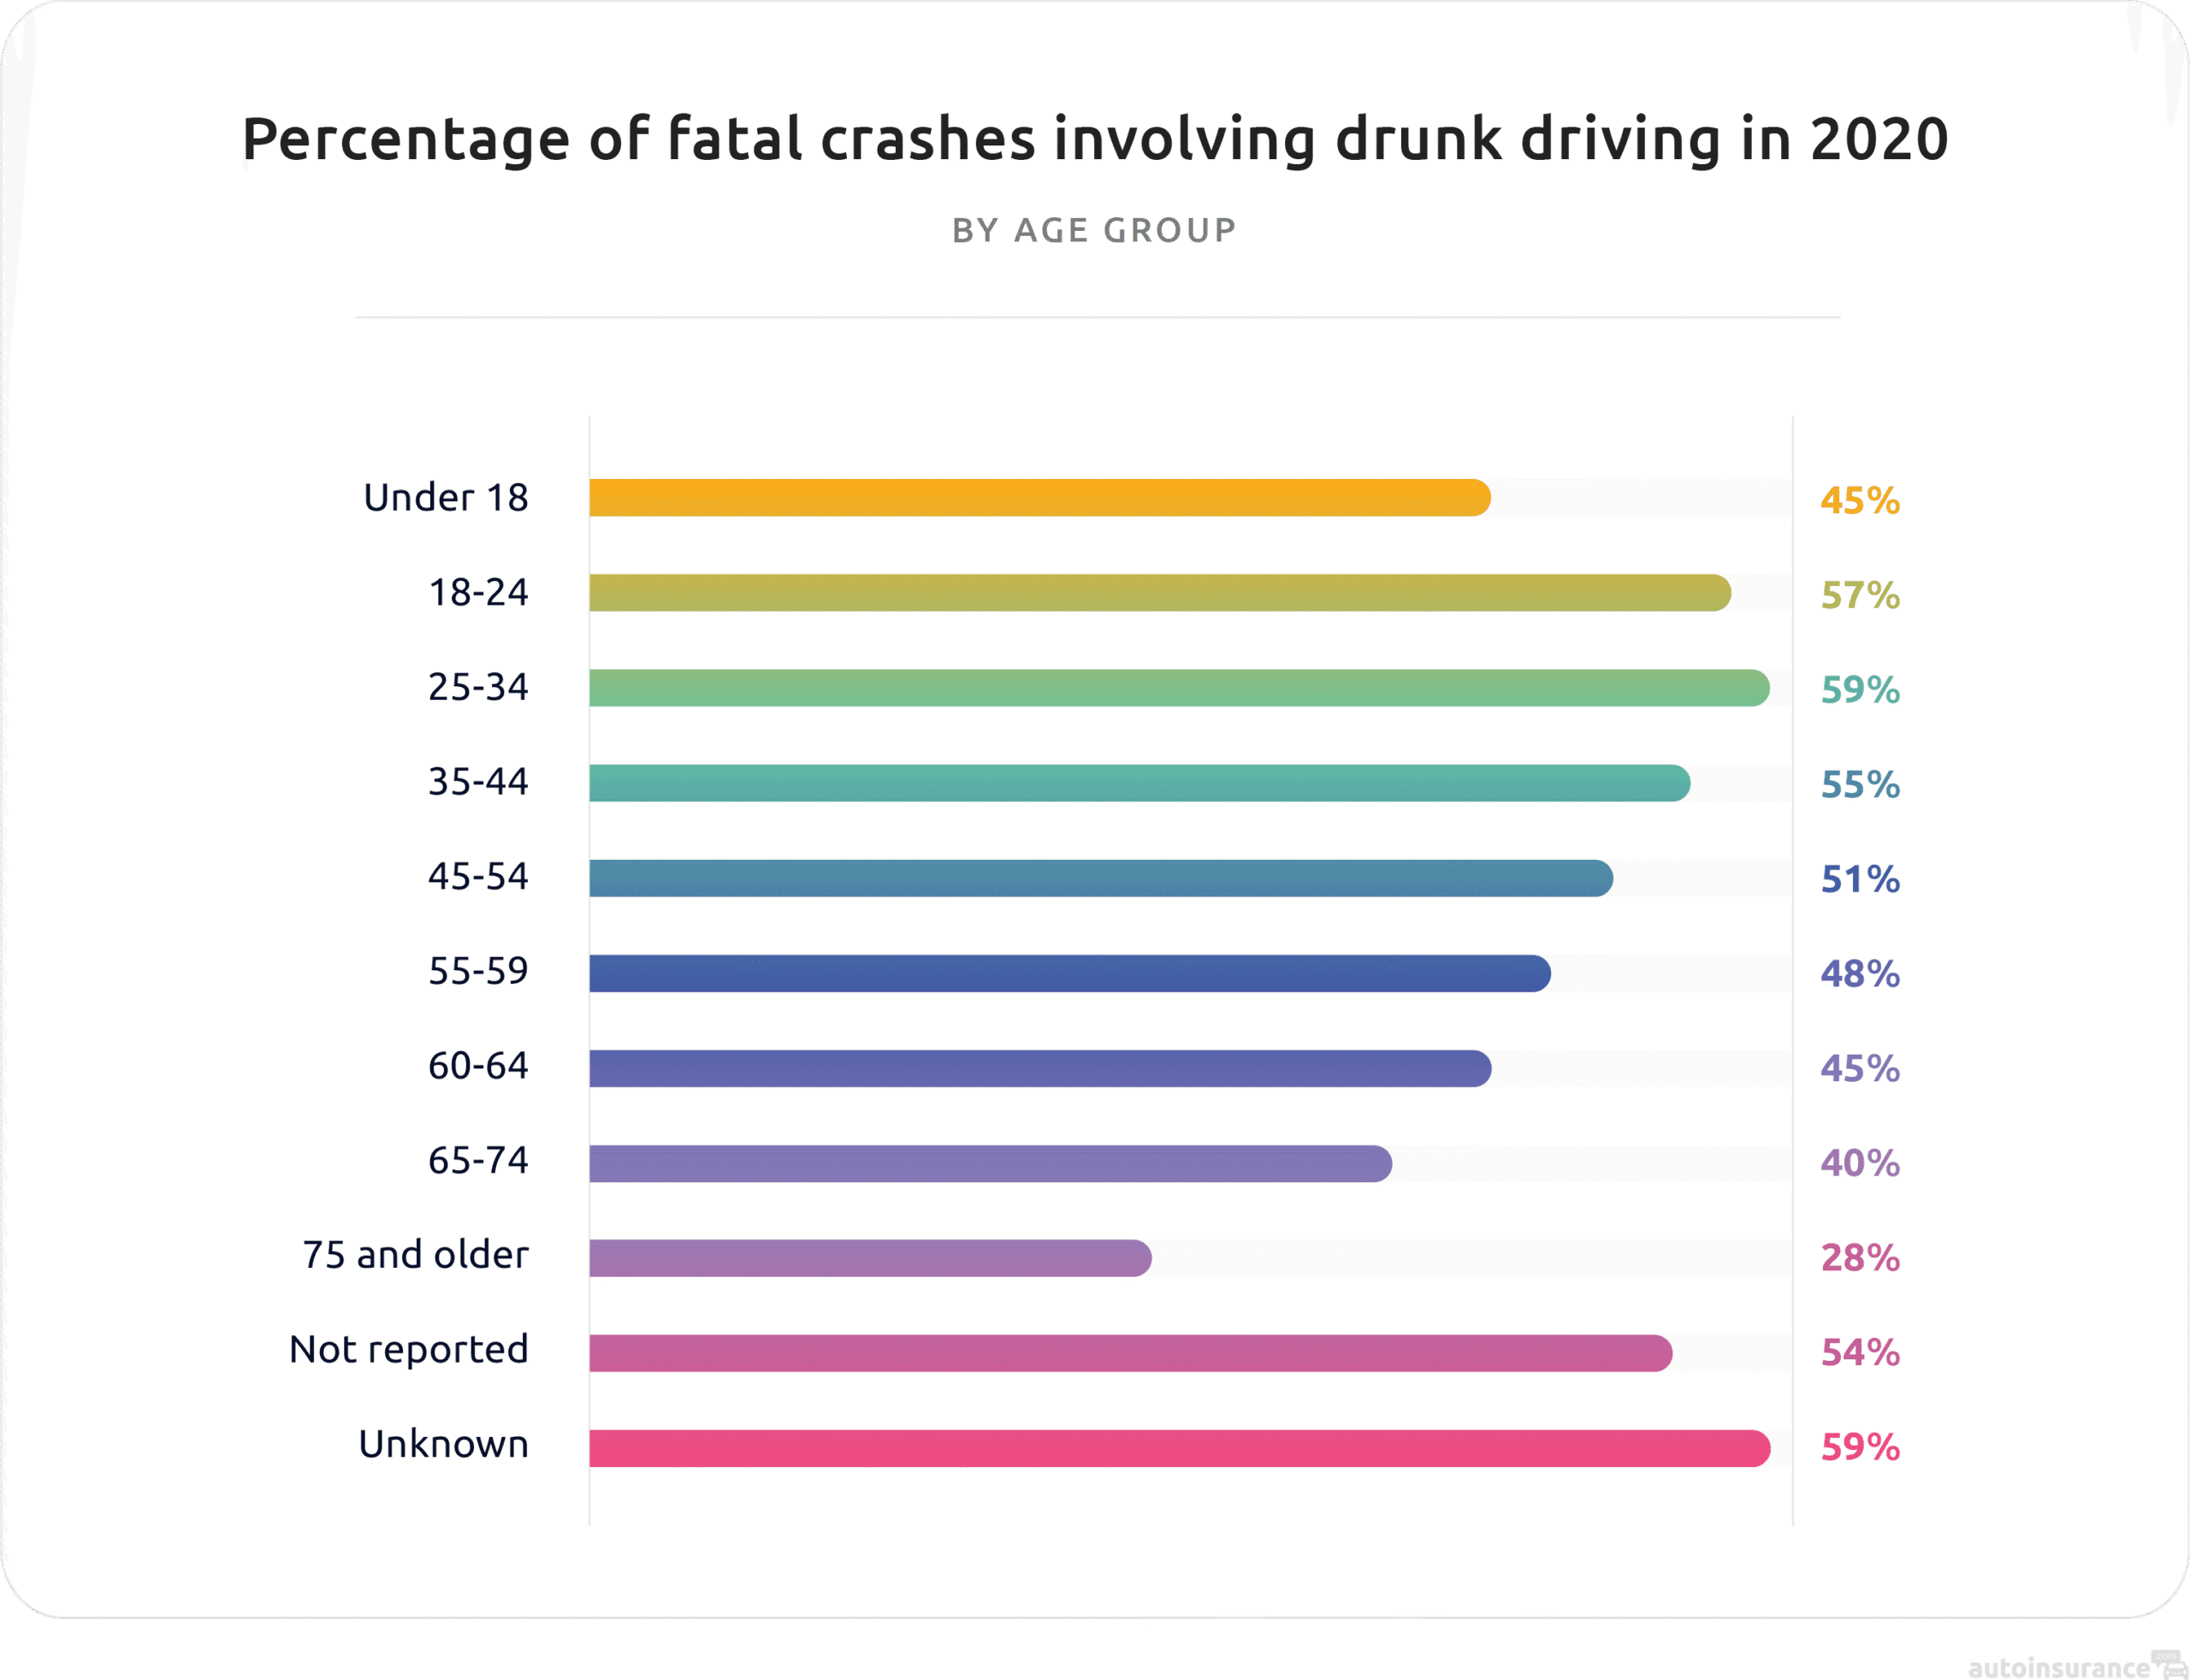
While teen drivers get a bad reputation for underage drinking and driving, in 2022 adults in their early 20s (aged 21-24) experienced the highest rate of death from drunk driving. A total of 43 percent of fatal crashes among this age group involved drunk driving. This marks a change from 2020 when adults aged 25-34 were the highest-risk demographic for drunk driving.4
Senior drivers (aged 75 and older) had the lowest drunk driving rates by age group in 2022. Only 13 percent of all traffic fatalities in that age group involved alcohol impairment. Generally, the likelihood of drunk driving peaks at age 34 and steadily declines through late adulthood.
According to the NHTSA, 25 percent of children aged 14 or younger killed in road crashes in 2022 were killed by drunk driving.
| Age Group | Percent of fatal crashes involving a drunk driver |
|---|---|
| 15 – 20 | 31% |
| 21 – 24 | 43% |
| 25 – 34 | 41% |
| 35 – 44 | 36% |
| 45 – 54 | 34% |
| 55 – 64 | 27% |
| 65 – 74 | 19% |
| 75+ | 13% |
By Passenger/Person Type
Drunk driving doesn’t just put the driver at risk, but everyone around them too. According to the Insurance Information Institute, in 2022, one-third of all passenger fatalities involved drunk driving. 35 percent of motorcyclist fatalities, 19 percent of pedestrian fatalities, and 16 percent of cyclist fatalities involved drunk driving.
| Person type | Total fatalities (all causes), 2022 | Fatalities involving drunk driving, 2022 | Percentage of total fatalities that involved drunk driving, 2022 |
|---|---|---|---|
| Driver | 20,908 | 7,580 | 36% |
| Passenger | 6,393 | 2,144 | 34% |
| Unknown occupant | 43 | 4 | 10% |
| Motorcyclists | 6,218 | 2,160 | 35% |
| Pedestrian | 7,522 | 1,394 | 19% |
| Cyclist | 1,105 | 177 | 16% |
| Unknown nonoccupant | 325 | 64 | 20% |
Drunk Driving Deaths vs. Gun Deaths
In 2023, gun violence killed 3.75 more people across the U.S. than drunk driving. Nationally, 46,728 people died from gun violence, compared to 12,429 who were killed by drunk driving.4
This hasn’t always been the case. In 2020, for example, drunk driving deaths outnumbered deaths from gun violence, killing 21,928 more people in the U.S. than guns, according to data from the Violence Policy Center.5
See your state’s comparison below:
| State | Number of gun deaths, 2022 | Number of alcohol-impaired motor vehicle deaths, 2022 |
|---|---|---|
| Alabama | 1,278 | 281 |
| Alaska | 164 | 20 |
| Arizona | 1,535 | 450 |
| Arkansas | 666 | 153 |
| California | 3,484 | 1,479 |
| Colorado | 1,036 | 260 |
| Connecticut | 252 | 127 |
| Delaware | 124 | 49 |
| Florida | 3,232 | 940 |
| Georgia | 2,163 | 507 |
| Hawaii | 66 | 37 |
| Idaho | 338 | 69 |
| Illinois | 1,798 | 471 |
| Indiana | 1,211 | 274 |
| Iowa | 367 | 116 |
| Kansas | 492 | 109 |
| Kentucky | 840 | 176 |
| Louisiana | 1,266 | 267 |
| Maine | 179 | 62 |
| Maryland | 813 | 207 |
| Massachusetts | 263 | 123 |
| Michigan | 1,504 | 305 |
| Minnesota | 561 | 130 |
| Mississippi | 848 | 168 |
| Missouri | 1,489 | 290 |
| Montana | 274 | 71 |
| Nebraska | 244 | 67 |
| Nevada | 618 | 140 |
| New Hampshire | 156 | 52 |
| New Jersey | 468 | 177 |
| New Mexico | 571 | 152 |
| New York | 1,044 | 371 |
| North Carolina | 1,831 | 460 |
| North Dakota | 125 | 34 |
| Ohio | 1,831 | 471 |
| Oklahoma | 797 | 186 |
| Oregon | 655 | 232 |
| Pennsylvania | 1,941 | 338 |
| Rhode Island | 37 | 22 |
| South Carolina | 1,105 | 474 |
| South Dakota | 141 | 44 |
| Tennessee | 1,480 | 364 |
| Texas | 4,630 | 1,869 |
| Utah | 446 | 71 |
| Vermont | 84 | 26 |
| Virginia | 1,316 | 298 |
| Washington | 1,022 | 256 |
| Washington, D.C. | 154 | 12 |
| West Virginia | 311 | 60 |
| Wisconsin | 830 | 171 |
| Wyoming | 124 | 40 |
DUIs vs. DWIs
When it comes to drunk driving, you may hear a lot of acronyms thrown around: DUI, DWI, OWI, SR-22 and more. But what’s the difference between DUIs and DWIs?
- DUIs: DUI stands for “driving under the influence” with a vehicle either in motion or, in some states, under a person’s control — meaning you can get a DUI for sitting in a parked car.6
- DWIs: DWI, which stands for “driving while intoxicated,” is a more serious charge than DUI, as it refers exclusively to drinking and driving. Convictions are often based on BAC levels.
Are DUIs and DWIs Felonies?
Both DUIs and DWIs can be misdemeanors or felonies, depending on whether it was a first offense and the results of the incident, such as any deaths or serious injuries. While misdemeanors typically result in a maximum sentence of one year in jail and a $1,000 fine, felonies could mean years in prison, thousands in fines, license suspension and a loss of voting rights in the most extreme cases.
How Alcohol Impairs Your Driving Ability
Whether you’re driving under the influence of just alcohol or mixing alcohol with drugs, your driving will be affected negatively. Here’s how.
Alcohol Alone
- Impaired judgment: Alcohol makes it difficult to judge the speed and movement of other vehicles and the distance between them, making it easy to drift into other lanes or even run off the road.
- Blurred vision: You may have double vision, which is more than a little distracting. Even with a BAC as low as .02 g/dl, your eyesight could be affected.
- Inability to distinguish colors: Drunk drivers may find it difficult to distinguish colors in signals, roadway markings and traffic signs.
- Slowed reaction times: Your reflexes aren’t as quick when you’re intoxicated, as alcohol is a depressant. That makes driving defensively difficult, if not impossible.
Alcohol and Drugs
- Alcohol and marijuana: Combining alcohol and marijuana while driving can further slow your judgment, reaction times and coordination, exacerbating the effects of alcohol alone.
- Alcohol and medications: Whether they’re prescription or over-the-counter (OTC), some medications cause dizziness and drowsy driving. You should always ask your doctor or pharmacist before driving on medication, even if you’re not under the influence of alcohol too.
Risk Factors
Speeding
Speeding is also related to drunk driving, according to data from the National Safety Council.7 One-third of speeding drivers who died in traffic crashes in 2020 were drunk. Learn more about teen speeding.
People with Prior Convictions
Not surprisingly, people with previous convictions for driving while impaired were more likely to die in fatal crashes compared to those with no prior conviction — four times more likely, to be specific.
Alcohol Concentration
While a 0.08 BAC is the legal threshold for drunk driving, research shows that the likelihood of a crash increases at a 0.05 BAC. Drivers who have a BAC higher than 0.15 are three times more likely to be killed in a drunk driving incident.8
Additional Consequences of Drunk Driving
Drunk driving poses other serious risks in addition to injury, property damage, and death.
Legal
Of course, it’s illegal to drive drunk in every state and doing so can result in either a misdemeanor or felony charge. A drunk-driving conviction could result in:
- Driver’s license revocation
- Ignition interlock requirement
- Fines
- Jail time
- Legal fees
- SR-22 requirement
FYI:
An SR-22 is a form that proves you have the minimum coverage your state requires in car insurance. However, some states require FR-44s, which require more coverage than the bare minimum.
Financial
Aside from the legal fees you may have to pay following a drunk-driving conviction, there’s also the increased cost of car insurance with a DUI on your record. On average, you can expect your insurance rate to increase by 80 percent, with some insurers raising premiums anywhere from 28 percent to 371 percent. That increase will affect your insurance rates until your DUI is off your motor vehicle report, after which your rates should go back to normal.
However, getting a DUI off your motor vehicle report could take years and, in the meantime, you’ll have issues finding affordable insurance as you’ll be considered a high-risk or nonstandard driver. To explore your options, check out our recommendations for the best high-risk auto insurance.
How to Drink Responsibly and Prevent Drunk Driving
- Choose a designated driver: Before you go out, designate one person in your friend group to be your sober driver.
- Don’t let others drink and drive: If you see a drunk person trying to drive, take their keys away from them. Help them arrange a ride home if you can.
- Use other modes of transportation: Rather than driving yourself, use other modes of transportation such as public transit, rideshares or taxis.
- Wear your seatbelt: Seatbelts can greatly reduce your risk of injuries or death, no matter who’s behind the wheel.
If you need help with alcohol consumption or alcohol-related issues, contact the American Addiction Centers at (888) 988-0482 for free, confidential guidance.
Conclusion
Drunk driving can have devastating, lifelong consequences for you and those around you. Sadly, the number of drivers killed thanks to drunk driving has risen since 2019, although it did decrease by about 0.5 percent between 2021 and 2022.
Staying off the road when intoxicated is one of the simplest things you can do to keep yourself and others safe. The cost of a taxi or rideshare is a fraction of the potential cost and consequences—financial and physical—of a crash or DUI.
Methodology
We used third-party sources to create this report, including:
- Insurance Information Institute
- NHTSA
- National Safety Council
- Nolo
- Violence Policy Center
Frequently Asked Questions
According to the most recent data from the National Survey on Drug Use and Health, about 7 percent of U.S. residents ages 16 and older admitted to driving under the influence of alcohol in the prior year.
France had the highest average number of days where people consumed alcohol in 2020: 132 days out of 365 (about 36 percent of the time). People in the U.S., in contrast, drank about 22 percent of the time, according to the 2021 Global Drug Survey.
According to 2022 data from the NHTSA, South Carolina and Rhode Island had the highest percentage of drunk driving incidents across the U.S. In both states, 43 percent of all fatal crashes involved drivers with a BAC of 0.08 percent or higher.
It’s estimated one in 50 U.S. drivers have a DUI on their record or about two percent of drivers.
Citations
Drunk Driving. National Highway Traffic Safety Administration. (2023).
https://www.nhtsa.gov/risky-driving/drunk-drivingFacts + Statistics: Alcohol-impaired driving. Insurance Information Institute. (2024).
https://www.iii.org/fact-statistic/facts-statistics-alcohol-impaired-drivingPersons Killed, by STATE and Highest Driver Blood Alcohol Concentration (BAC) in Crash – State : USA, Year : 2022. NHTSA FARS. (2024).
https://www-fars.nhtsa.dot.gov/States/StatesAlcohol.aspxGuns. National Safety Council (NSC). (2024).
https://injuryfacts.nsc.org/home-and-community/safety-topics/guns/Gun Deaths Outpace Motor Vehicle Deaths in 34 States and the District of Columbia in 2020. Violence Policy Center. (2022, Apr).
https://vpc.org/studies/gunsvsmotorvehicles22.pdfDUI and DWI Overview. NOLO. (2023).
https://www.nolo.com/legal-encyclopedia/dui-dwi-overview-30316.htmlMotor Vehicle Safety Issues: Speeding. National Safety Council Injury Facts. (2023).
https://injuryfacts.nsc.org/motor-vehicle/motor-vehicle-safety-issues/speeding/Drunk driving risk factors. State of Wisconsin Department of Transportation. (2024).
https://wisconsindot.gov/Pages/safety/education/drunk-drv/ddrisk.aspx
Related Articles
The Safest Cars According to Insurance Loss Data
March 10, 2026Why is Car Insurance So Expensive in New York?
March 5, 2026Best Cheap Car Insurance in New York City
February 24, 2026