
AutoInsurance.com is supported by commissions from providers listed on our site. Read our Editorial Guidelines.
Find Your Perfect Policy:877-817-3636
Find Your Perfect Policy:877-817-3636
Last updated: March 10, 2026
The Safest Cars According to Insurance Loss Data
Insurance loss data indicates that larger cars tend to be safer, based on the size and frequency of claims against these vehicles. Popular models that top the list include the Subaru Outback, Jeep Wrangler, and Ford R-150.
Get quotes from providers in your area

Driving is one of the most dangerous activities most people regularly engage in, so it’s important to prioritize a safe vehicle. One way to evaluate how safe different cars are is through crash safety test results, which are published every year by the Insurance Institute for Highway Safety (IIHS) and the National Highway Traffic Safety Administration (NHTSA).
While these ratings are very useful, insurance loss data — specifically for first-party injury and collision claims — can provide further insights into which cars are the safest on the road based on the frequency and size of insurance claims.
Key Takeaways
- Insurance loss data, specifically first-party injury claims and collision claims, can provide useful insights into car safety. This information highlights which vehicles sustain the most damage and prompt owners to file injury claims.
- The safest car models across various categories, based on insurance loss data, include the Mini Cooper, Subaru Outback, Ford Bronco, Jeep Wrangler, Toyota 4Runner, Volvo XC60, Ford F-150, and Chevrolet Silverado.
- When excluding collision data, which is impacted by the cost of vehicle repairs, larger vehicles like pickup trucks and SUVs top the list of safest vehicles.
- The manufacturers with the strongest safety records over time are Volvo, Jeep, and Subaru.
Safest Overall Car Models
The safest overall car models in our analysis have significantly lower-than-average losses for two key categories: first-party injury claims (which include personal injury protection and medical payments) as well as collision claims.
FYI:
The cars selected as the safest models have the lowest overall mix of collision, MedPay, and PIP insurance losses.
First-party injury claims refer to claims that a policyholder files with their own insurer. They reflect injuries sustained in a crash by the policyholder and any passengers. First-party injury claims are most common in no-fault states, which require personal injury protection (PIP) for each party to cover their own injuries resulting from an accident. Meanwhile, medical payments coverage is available as an optional add-on in most at-fault states and is similar to PIP but not as robust.
Collision claims are also a type of first-party claim, as they are filed by a driver with their own insurance company to cover damage to their vehicle. Collision claim losses indicate which cars are sustaining more expensive damage and are being damaged more frequently, which can speak to how safe they are. However, it’s important to note that collision claims are also impacted by the vehicle’s repair costs.
The data below is from 2022-2024 model years, and the losses are represented as a percentage above or below the average.1
Safest Traditional Cars
Traditional cars include sedans, hatchbacks, and station wagons. Our analysis revealed that Mini Coopers were one of the safest traditional cars, with collision losses that were 30 percent below the average for all passenger vehicles, MedPay losses 49 percent below average, and PIP losses 35 percent below average.
Collision losses reflect both the frequency of claims and the average loss per claim. MedPay and PIP losses reflect claim frequency only.
Note that the vehicles below are listed in order of size, not safety, given the varying ranking depending on which loss type is prioritized.
| Car make and model | Vehicle size category | Collision losses compared to average | MedPay losses compared to average | PIP losses compared to average |
|---|---|---|---|---|
| Mini Cooper | Mini two-door car | -30% | -49% | -35% |
| Volkswagen GTI | Small four-door car | -22% | -27% | -25% |
| Mini Countryman 4WD | Small station wagon | -22% | -27% | -32% |
| Subaru Crosstrek station wagon 4WD with EyeSight | Small station wagon | -37% | -18% | -21% |
| Subaru Outback 4WD with EyeSight | Midsize station wagon | -37% | -26% | -29% |
Safest SUVs
| Car make and model | Vehicle size category | Collision losses | MedPay losses | PIP losses |
|---|---|---|---|---|
| Ford Bronco 2dr convertible 4WD | Midsize SUV | -45% | -49% | -52% |
| Ford Bronco 4dr convertible 4WD | Midsize SUV | -34% | -45% | -43% |
| Jeep Wrangler 2dr convertible 4WD | Midsize SUV | -53% | -46% | -33% |
| Toyota 4Runner 4dr 4WD | Midsize SUV | -33% | -38% | -30% |
| Volvo XC60 4dr 4WD | Midsize luxury SUV | -20% | -47% | -43% |
| GMC Yukon 4dr | Large SUV | -34% | -53% | -48% |
| Chevrolet Tahoe 4dr 4WD | Large SUV | -23% | -43% | -42% |
Safest Pickups
| Car make and model | Vehicle size category | Collision losses | MedPay losses | PIP losses |
|---|---|---|---|---|
| Ford F-150 SuperCab 4WD | Large pickup | -26% | -37% | -42% |
| Chevrolet Silverado 1500 ext. cab 4WD | Large pickup | -25% | -28% | -32% |
| Ford F-250 SuperCrew 4WD | Very large pickup | -15% | -54% | -46% |
| Chevrolet Silverado 2500 crew cab 4WD | Very large pickup | -17% | -46% | -45% |
Safest Car Models by Collision Claim Losses
As mentioned above, when it comes to collision claims, it’s important to note that vehicle repair costs come into play. In other words, some vehicles with low losses from first-party injury claims have higher collision losses simply because they are expensive to repair or replace, but they would still be considered safe cars. This should be taken into account when looking at collision data, but it offers interesting insights nonetheless.
Generally speaking, larger vehicles tend to be safer, as evidenced by the data below. The ten vehicles with the lowest collision losses range from midsize SUVs to very large pickups.
| Car make and model | Vehicle category and size | Collision losses |
|---|---|---|
| Ineos Grenadier 4dr 4WD | Large SUV | -77% |
| Ford F-350 4WD | Very large pickup | -69% |
| Ford T-350 Transit cargo 4WD | Very large van | -58% |
| Jeep Wrangler 2dr convertible 4WD | Very large van | -53% |
| Chevrolet Express 2500 ext. cargo | Midsize SUV | -53% |
| GMC Sierra 2500 4WD | Very large pickup | -47% |
| Ford Bronco 2dr convertible 4WD | Very large van | -45% |
| Ford T-150 Transit cargo | Midsize SUV | -45% |
| Ford F-350 SuperCab 4WD | Very large pickup | -42% |
| Chevrolet Express 2500 cargo | Very large van | -42% |
| Ram 2500 4WD | Very large pickup | -41% |
| Jeep Wrangler 4dr convertible 4WD | Midsize SUV | -40% |
| GMC Sierra 3500 4WD | Very large pickup | -40% |
| Mini Cooper electric 2dr | Mini two-door car | -39% |
| Ram ProMaster 3500 | Very large van | -38% |
Safety of Popular Cars by Collision Claim Losses
When looking at only a selection of the most popular cars in the U.S., several small SUVs come out on top. The pickup trucks’ higher losses are likely due in part to the fact that they are more expensive to repair. The four-door cars are still at the bottom of the list, however, despite being cheaper to repair.
| Car make and model | Vehicle size | Collision losses |
|---|---|---|
| Toyota RAV4 4dr | Small SUV | -28% |
| Honda CR‑V hybrid 4dr 4WD | Small SUV | -23% |
| Nissan Rogue 4dr | Small SUV | -18% |
| Ford F‑150 SuperCrew 4WD | Large pickup truck | -14% |
| Chevrolet Equinox 4dr | Small SUV | -14% |
| Toyota Tundra CrewMax 4WD | Large pickup truck | -8% |
| GMC Sierra 1500 ext. cab 4WD | Large pickup truck | -7% |
| Ram 1500 crew cab LWB 4WD | Large pickup truck | -6% |
| Chevrolet Silverado 1500 crew cab | Large pickup truck | -6% |
| Ford Escape 4dr | Small SUV | -5% |
| Honda Accord | Four‑door car | 9% |
| Toyota Camry | Four‑door car | 19% |
| Chevrolet Malibu | Four‑door car | 24% |
| Nissan Altima | Four‑door car | 35% |
| Hyundai Sonata | Four‑door car | 36% |
Safest Car Models by First-Party Injury Claim Losses
Looking at insurance loss data for PIP and MedPay claims provides an idea of which vehicles are safer than others based on how often and for how much their owners file injury-related claims.
When removing collision repair costs from the equation, two Rivian models top the list, as their heavy battery packs provide great protection to occupants, even though they are more expensive to repair in a collision. Overall, most vehicles on this list are SUVs or bigger, underscoring the safety of larger vehicles.
| Car make and model | Vehicle category and size | MedPay losses | PIP losses |
|---|---|---|---|
| Rivian R1T 4dr electric 4WD | Large pickup | -63% | -63% |
| Rivian R1S electric 4dr 4WD | Large luxury SUV | -61% | -57% |
| GMC Canyon crew cab 4WD | Small pickup | -59% | -51% |
| Chevrolet Corvette convertible | Midsize sports car | -58% | -47% |
| Ford F-250 SuperCrew 4WD | Very large pickup | -54% | -46% |
| GMC Yukon 4dr | Large SUV | -53% | -48% |
| Ford F-350 SuperCrew 4WD | Very large pickup | -52% | -43% |
| GMC Sierra 2500 crew cab 4WD | Very large pickup | -51% | -48% |
| Land Rover Defender 110 4dr 4WD | Midsize luxury SUV | -51% | -52% |
| Land Rover Range Rover 4dr 4WD | Large luxury SUV | -50% | -56% |
| GMC Yukon 4dr 4WD | Large SUV | -49% | -41% |
| Ford Bronco 2dr convertible 4WD | Midsize SUV | -49% | -52% |
| GMC Sierra 3500 crew cab 4WD | Very large pickup | -49% | -47% |
| Volvo XC90 plug-in hybrid 4dr 4WD | Midsize luxury SUV | -48% | -43% |
| Volvo XC60 4dr 4WD | Midsize luxury SUV | -47% | -43% |
| Chevrolet Silverado 3500 crew cab 4WD | Very large pickup | -41% | -51% |
Safety of Popular Cars by First-Party Injury Claim Losses
A similar trend can be observed when looking at the list of popular vehicles: pickup trucks win, by far, when considering only first-party injury claims and excluding collision data.
The Ford F-150, Toyota Tundra, and Ram 1500 tie for the lowest MedPay losses at 37 percent less than average.
| Car make and model | Vehicle category and size | MedPay losses | PIP losses |
|---|---|---|---|
| Ford F‑150 SuperCrew 4WD | Large pickup truck | -37% | -35% |
| Ram 1500 crew cab LWB 4WD | Large pickup truck | -37% | -25% |
| Toyota Tundra CrewMax 4WD | Large pickup truck | -37% | -28% |
| GMC Sierra 1500 ext. cab 4WD | Large pickup truck | -36% | -37% |
| Honda CR‑V hybrid 4dr 4WD | Small SUV | -8% | 4% |
| Chevrolet Silverado 1500 crew cab | Large pickup truck | 1% | -3% |
| Toyota RAV4 4dr | Small SUV | 6% | 24% |
| Nissan Rogue 4dr | Small SUV | 25% | 23% |
| Chevrolet Equinox 4dr | Small SUV | 45% | 23% |
| Ford Escape 4dr | Small SUV | 51% | 38% |
| Honda Accord | Four‑door car | 62% | 71% |
| Toyota Camry | Four‑door car | 62% | 74% |
| Hyundai Sonata | Four‑door car | 63% | 50% |
| Chevrolet Malibu | Four‑door car | 104% | 80% |
| Nissan Altima | Four‑door car | 106% | 81% |
Crash Tests vs. Insurance Loss Results
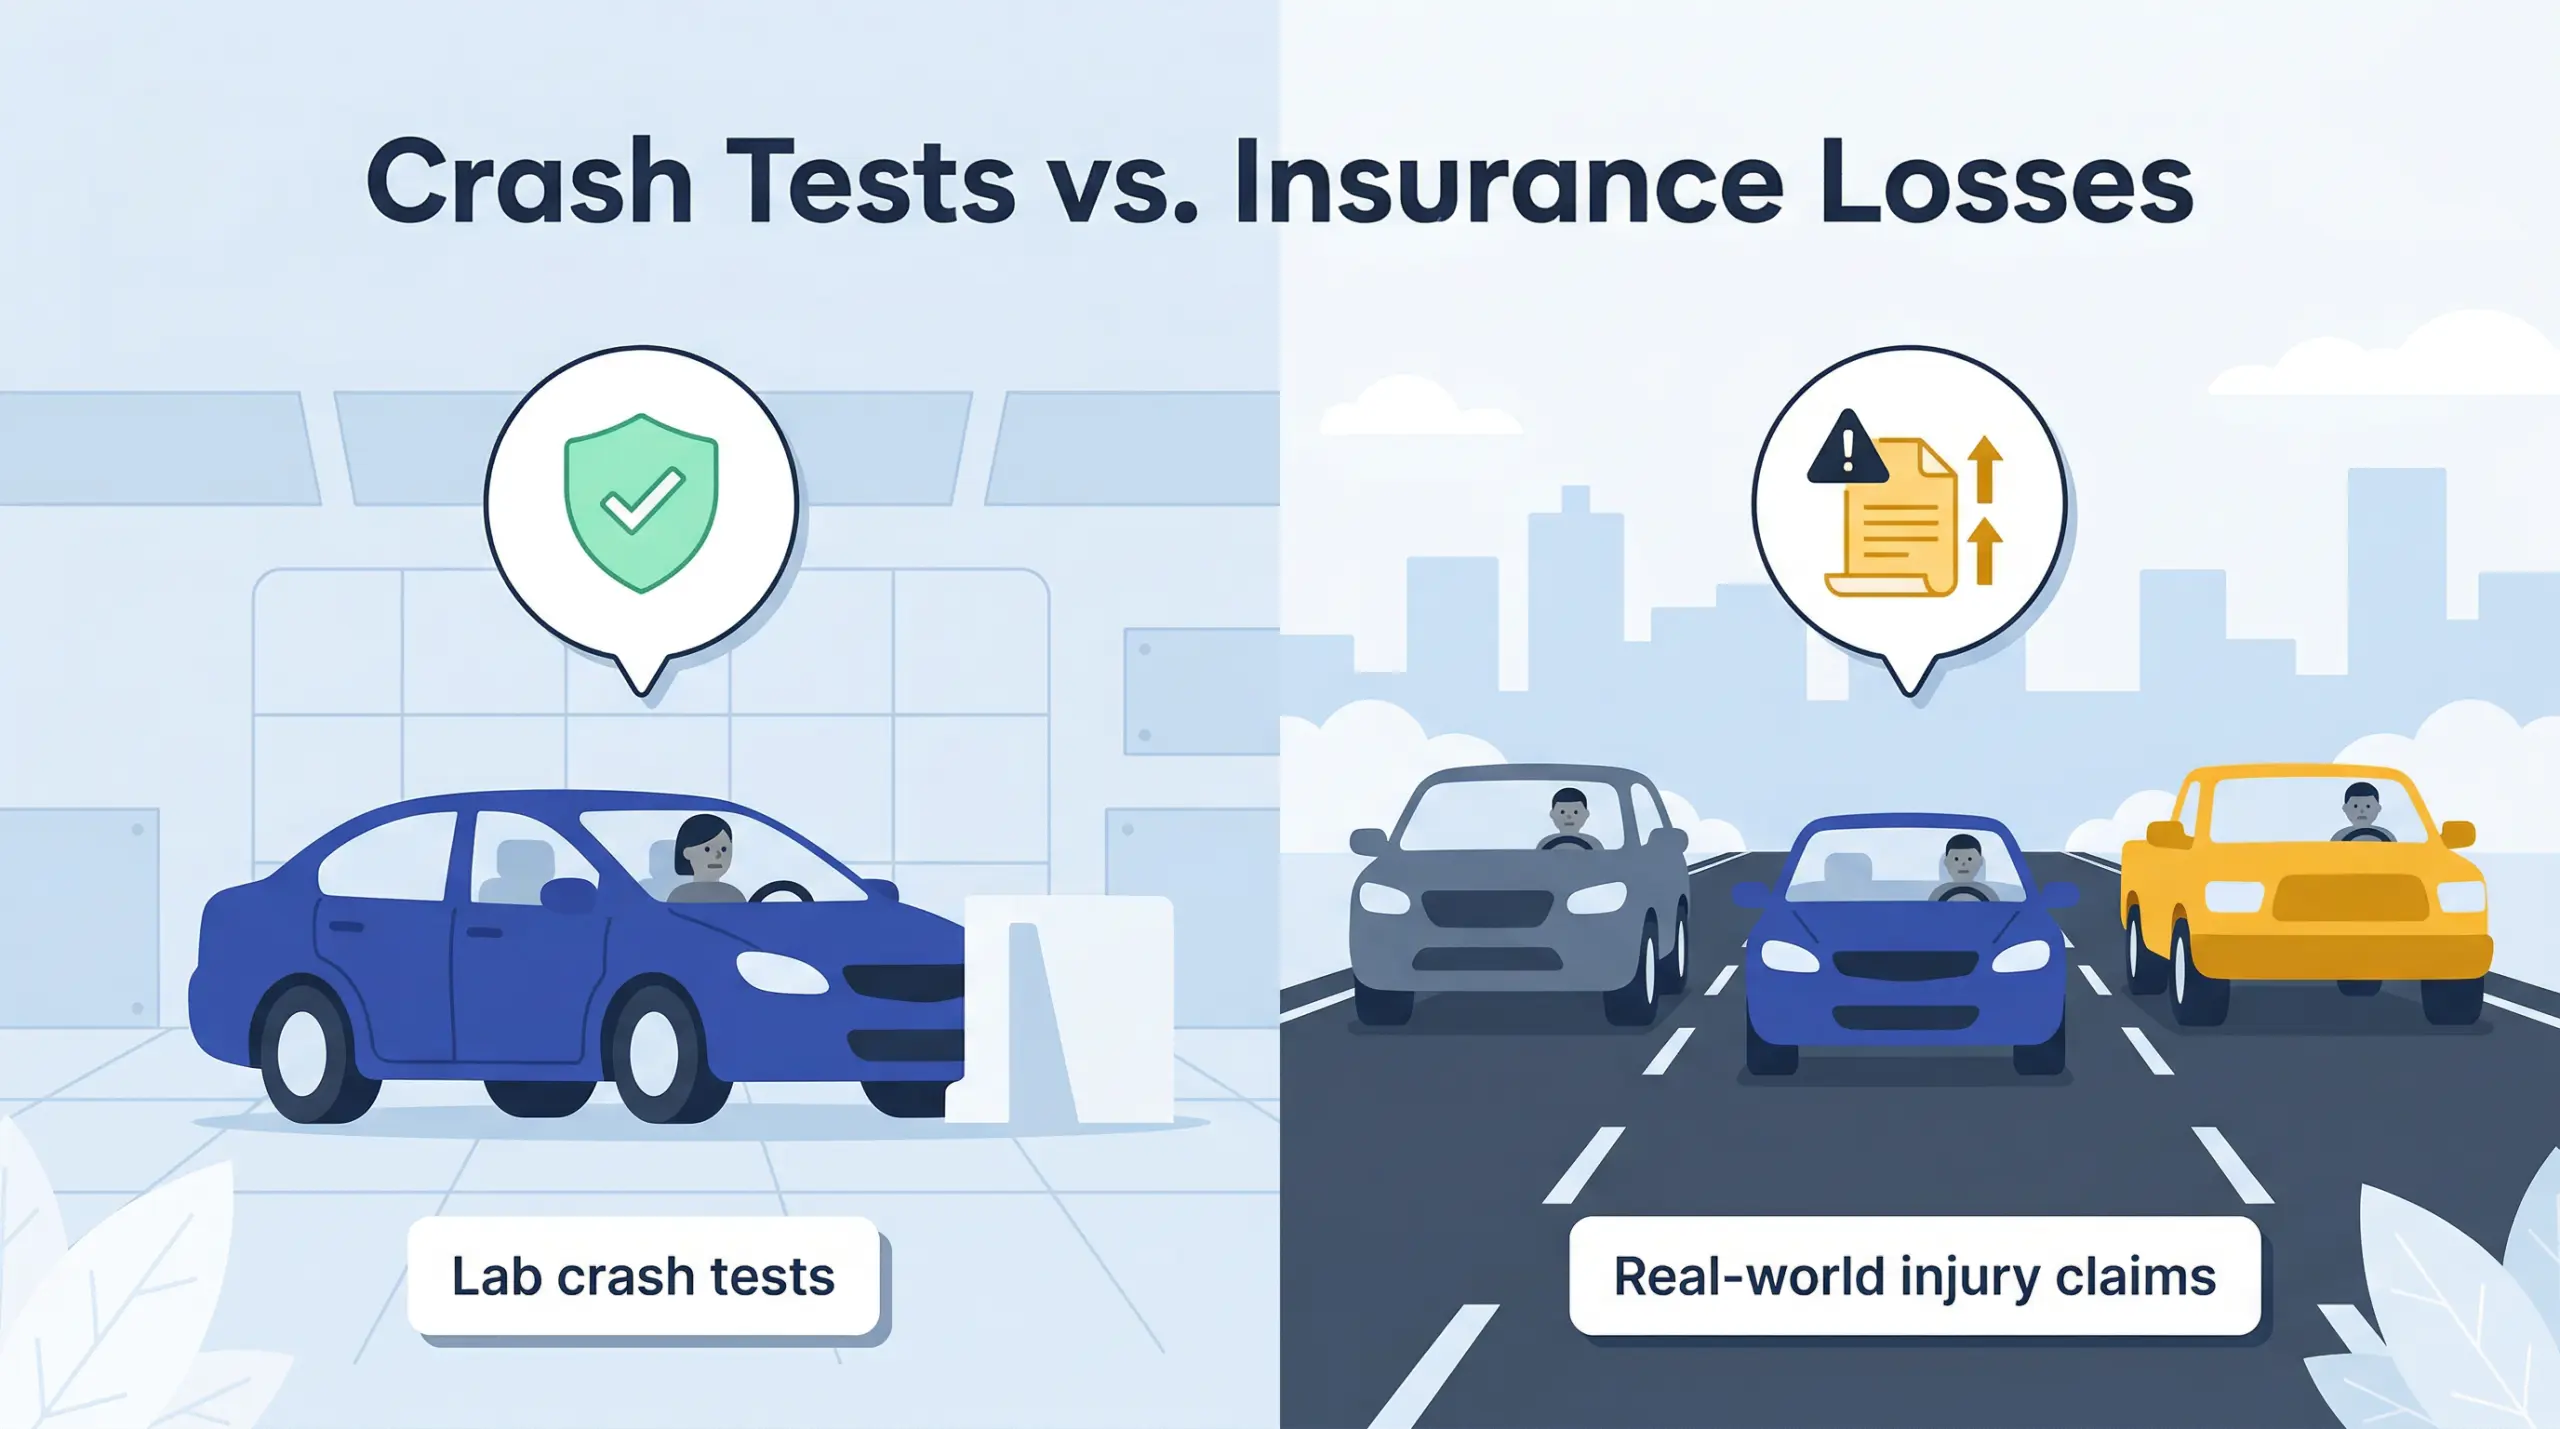
High marks in lab crash tests don’t necessarily mean a vehicle will have low real-world injury insurance claims.
The annual lists of “Safest Cars” from the NHTSA and IIHS are often looked to for data on which cars have the best safety record for a given year. These lists are compiled based on controlled laboratory crash testing and active safety features, and include popular sedans like the Honda Civic, Honda Accord, and Toyota Camry.
However, importantly, these tests do not account for real-world performance, and insurance loss data actually reveals that these vehicles perform significantly worse than the national average in terms of real-world injury claims. This is largely due to their smaller size relative to the SUVs and trucks dominating the roads.
Cars With the Most Significant Safety Improvements
IIHS insurance loss data points to some interesting trends over time, even if there are some important caveats. The data for a given time frame measures a vehicle’s losses relative to the average of that specific period, so it’s not possible to make apples-to-apples comparisons. In addition, cars have become much safer in general over the past several decades, but those mentioned here have shown improvements beyond the average.
Data was categorized a bit differently in the past — most notably, only PIP claims were tracked and were referred to simply as “injury” claims. For ease of comparison, we have referred to this as PIP in the table below.
Note that these cars still may not be among the top safest cars (i.e., those with the lowest losses), but they have shown the biggest improvements between the 1990s and today.
| Car make and model | Losses in the 1990s | Losses in 2022-2024 |
|---|---|---|
| Kia Sportage 4dr 4WD | PIP: 71% worse than average
Collision: 15% worse than average | PIP: 21% worse than average
Collision: 7% worse than average |
| Jeep Wrangler 2-door 4WD | PIP: 6% better than average
Collision: 22% better than average | PIP: 33% better than average
Collision: 53% better than average |
| Subaru Outback 4WD | PIP: 12% better than average
Collision: 7% worse than average | PIP: 29% better than average
Collision: 37% worse than average |
| Chevrolet Corvette | PIP: 32% better than average
Collision: 67% worse than average | PIP: 45% better than average
Collision: 27% worse than average |
It’s also worth noting that, generally speaking, many popular sedans that were once safer than average have become less safe over time as larger vehicles have dominated the modern market.
Safest Affordable Cars
While safety is important to prioritize when it comes to a car, budget is as well. Many of the safest cars according to insurance loss data are luxury SUVs and pickup trucks, which are not the most affordable options.
Of course, the full cost of a car includes more than the purchase price — there is also the cost to maintain it over time, as well as the cost of insurance. More affordable cars, in addition to having a lower replacement cost, also tend to be cheaper to repair, which in turn makes them cheaper to insure.
The following cars offer some of the best value in terms of cost (both purchase and insurance) and safety record. It’s worth calling out the Mini Cooper, in particular, whose safety record is an outlier for small cars, making it a great option for new drivers looking for a small and safe car.
| Car make and model | Vehicle size | Approximate Base MSRP | Collision losses | MedPay losses | PIP losses |
|---|---|---|---|---|---|
| Mini Cooper | Mini two-door car | $29,500 | -30% | -49% | -35% |
| Volkswagen Taos 4dr 4WD | Small SUV | $28,500 | -35% | -13% | -14% |
| Volkswagen GTI | Small four-door car | $34,590 | -22% | -27% | -25% |
| Subaru Crosstrek 4WD with EyeSight | Small station wagon | $25,695 | -37% | -18% | -21% |
| Subaru Forester 4WD with EyeSight | Small SUV | $29,995 | -36% | -24% | -24% |
| Subaru Outback 4WD with EyeSight | Midsize station wagon | $34,995 | -37% | -26% | -29% |
| Mazda CX-5 4WD | Small SUV | $29,990 | 20% | -18% | 15% |
| Volkswagen Tiguan 4WD | Midsize SUV | $30,805 | -32% | -14% | -21% |
| Honda Odyssey | Very large minivan | $42,795 | -20% | 16% | -11% |
| Chrysler Pacifica 4WD | Very large minivan | $44,445 | -27% | 30% | 29% |
Brands With the Strongest Long-Term Safety Performance
When examining historical IIHS data, certain brands stand out for consistently maintaining high safety ratings, which, in this case, are measured by low insurance claim losses. The following brands have maintained some of the lowest average losses over time:
| Manufacturer | Losses in the 1990s | Losses in 2022-2024 |
| Volvo | Model: 850
PIP: 37% better than average Collision: 6% better than average | Model: Volvo XC60 4dr 4WD
PIP: 43% better than average Collision: 20% better than average |
| Subaru | Model: Legacy 4WD
PIP: 22% better than average Collision: 7% better than average | Model: Outback 4WD with EyeSight
PIP: 29% better than average Collision: 37% better than average |
| Jeep | Model: Wrangler
PIP: 14% better than average Collision: 24% better than average | Model: Wrangler 2dr convertible 4WD
PIP: 33% better than average Collision: 53% better than average |
Insights From Combining Insurance Loss Data and Recall Data
Considering manufacturing recall data alongside real-world insurance loss data provides even more detail about a vehicle’s true safety record. Recall data accounts for manufacturing defects and automaker fixes, while insurance data provides a window into what actually happens when vehicles are on the road.
High recall counts don’t automatically mean a car is unsafe. It may seem reasonable to assume that vehicles with more recalls are less safe, but the evidence actually doesn’t support this. For example, Ford, Toyota, and Chrysler have the highest recall counts in the most recent data2, but many Ford and Toyota models — particularly SUVs and pickups — provide some of the best real-world injury protection based on insurance data. On the other hand, Chrysler’s vehicles do not fare as well in terms of insurance losses.
Recall and insurance loss data converge more when it comes to luxury and tech-heavy brands, including EVs. Lucid, for example, has one of the lowest recall completion rates in the industry. (Recall completion refers to the percentage of affected vehicles that are successfully repaired or otherwise remedied). In the IIHS data, the Lucid Air electric 4-door exhibits very high collision repair costs at 218 percent worse than the national average.
Tesla also struggles with recall completion, and Tesla vehicles consistently post high collision repair losses, with the Model S at 116 percent worse than average and the Model X at 118 percent worse than average. BMW, Mercedes, and other luxury brands have similarly high recall volumes and collision losses. This makes sense when you consider that these cars have high repair costs and complex technology — it doesn’t necessarily point to how safe they are, but rather how expensive they are to fix.
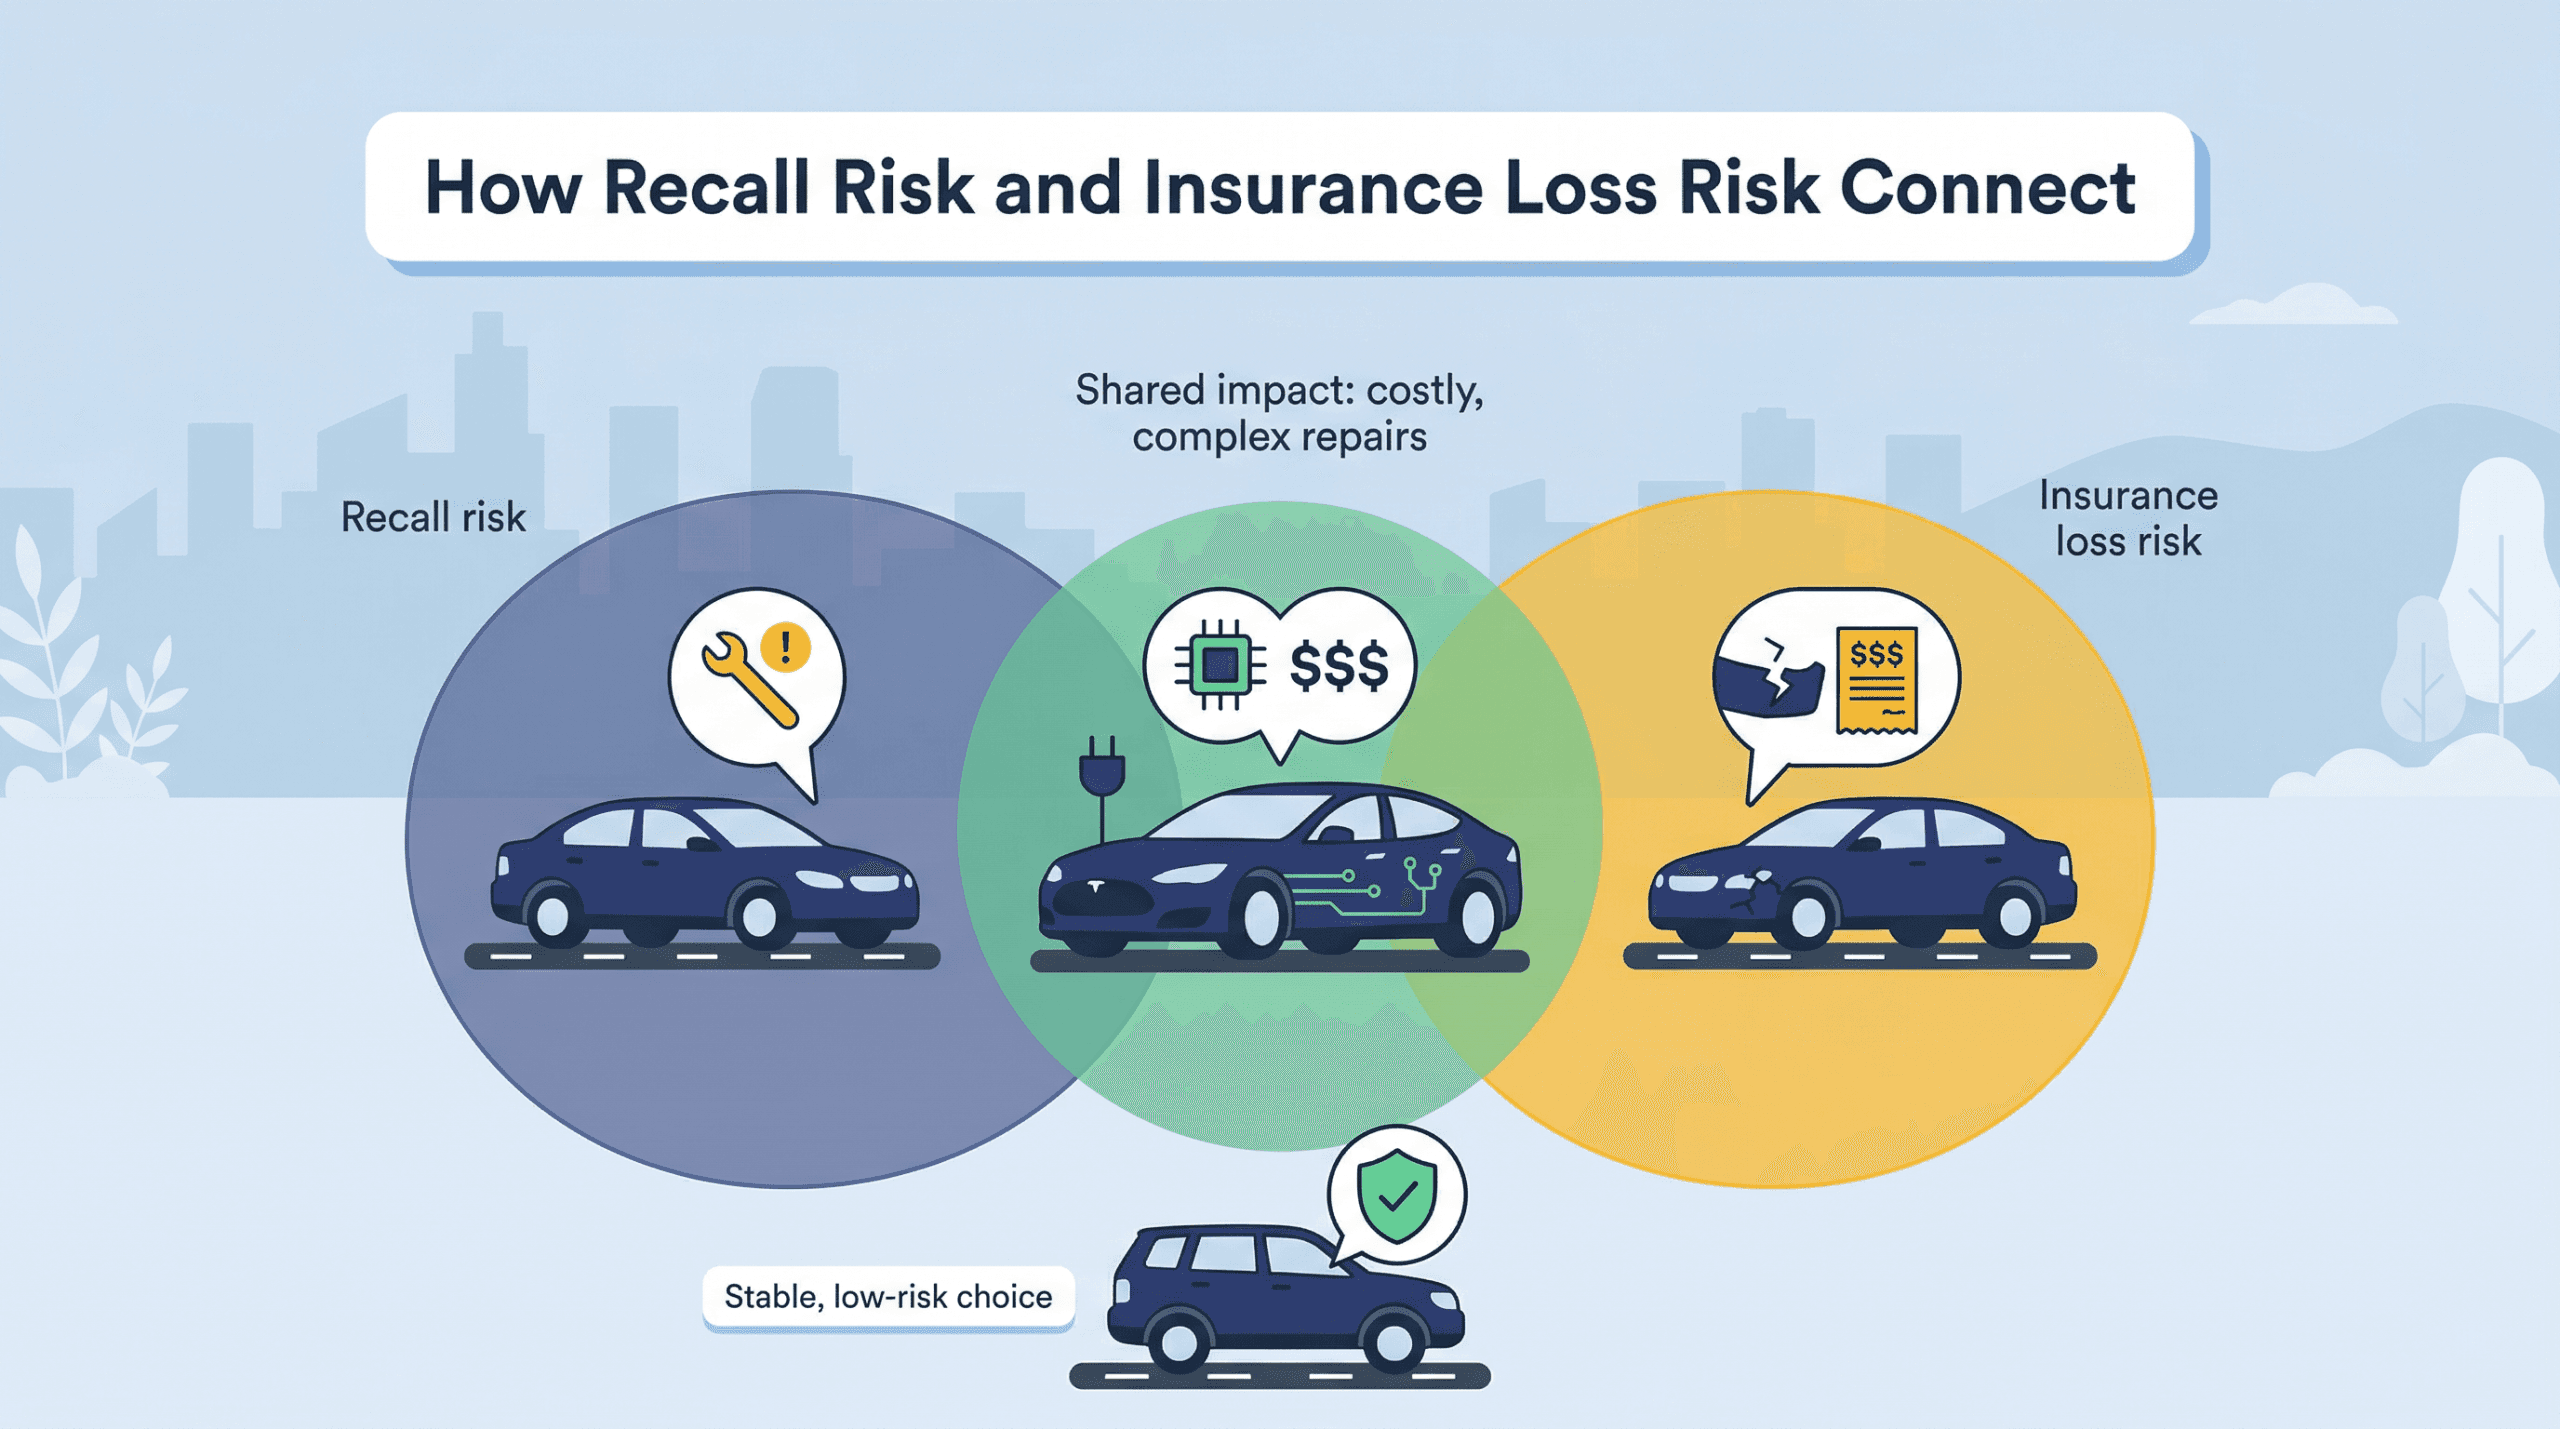
Recall and insurance loss risks overlap most significantly in luxury and electric vehicles where complexity drives up repair costs.
When looking at both datasets, Subaru emerges as a champion of overall vehicle reliability and safety. Subaru doesn’t top the list of manufacturers with the most recalls, and as noted in our previous analysis, many of its models have low insurance losses. By avoiding mass recalls and simultaneously posting low real-world insurance losses, Subaru models represent some of the most stable, risk-free investments for consumers.
In short: insurance loss risk (which represents crash outcomes) and recall risk (which relates to manufacturing defects) do not perfectly correlate with each other, but they do occasionally overlap. This is the case particularly in luxury and electric cars, where complexity drives both higher recall volume and higher repair costs.
Recap
Insurance loss data, particularly data relating to collision and first-party injury claims, offers a real-world look at which vehicles are least likely to generate costly injury and damage claims — and, in turn, which may be among the safest on the road. By analyzing patterns in collision, medical payments, and personal injury protection losses, we can conclude that larger cars, like SUVs and pickups, tend to be safer, but there are exceptions. First-party injury claim data is particularly useful, as it eliminates the repair cost variable.
While no car is guaranteed to prevent accidents, damage, or injuries, vehicles with lower-than-average claim losses often point to a strong safety record, making them smart choices for safety-conscious buyers.
Methodology
We evaluated data from the following third parties to compile this report:
- Insurance Institute for Highway Safety (IIHS)
- National Highway Traffic Safety Administration (NHTSA)
Sources
Insurance losses by make and model. Insurance Institute for Highway Safety. (2026).
https://www.iihs.org/research-areas/auto-insurance/insurance-losses-by-make-and-modelResources Related to Investigations and Recalls. NHTSA. (2026).
https://www.nhtsa.gov/resources-investigations-recalls
Related Articles
The Safest Cars According to Insurance Loss Data
March 10, 2026Why is Car Insurance So Expensive in New York?
March 5, 2026Best Cheap Car Insurance in New York City
February 24, 2026