
Last updated: March 27, 2026
Auto Insurance Statistics and Facts
Louisiana had the highest annual car insurance costs in 2020, with rates reaching nearly $1,500.
Get quotes from providers in your area

In all states except Virginia and New Hampshire, car insurance is a necessity for driving on public roads. Americans spent an average of $1,047 on car insurance in 2020, with rates ranging from only $692 in North Dakota up to $1,495 in Louisiana. Here are the most recent statistics you need to know about auto insurance in the United States.
The Cost of Auto Insurance in the U.S.
The good news: National average car insurance costs decreased from 2019 to 2020, the first decrease since 2011.
By Year
After multiple years of significant increases, car insurance premiums were finally on the decline in 2020, according to the most recent data available from the National Association of Insurance Commissioners (NAIC).1
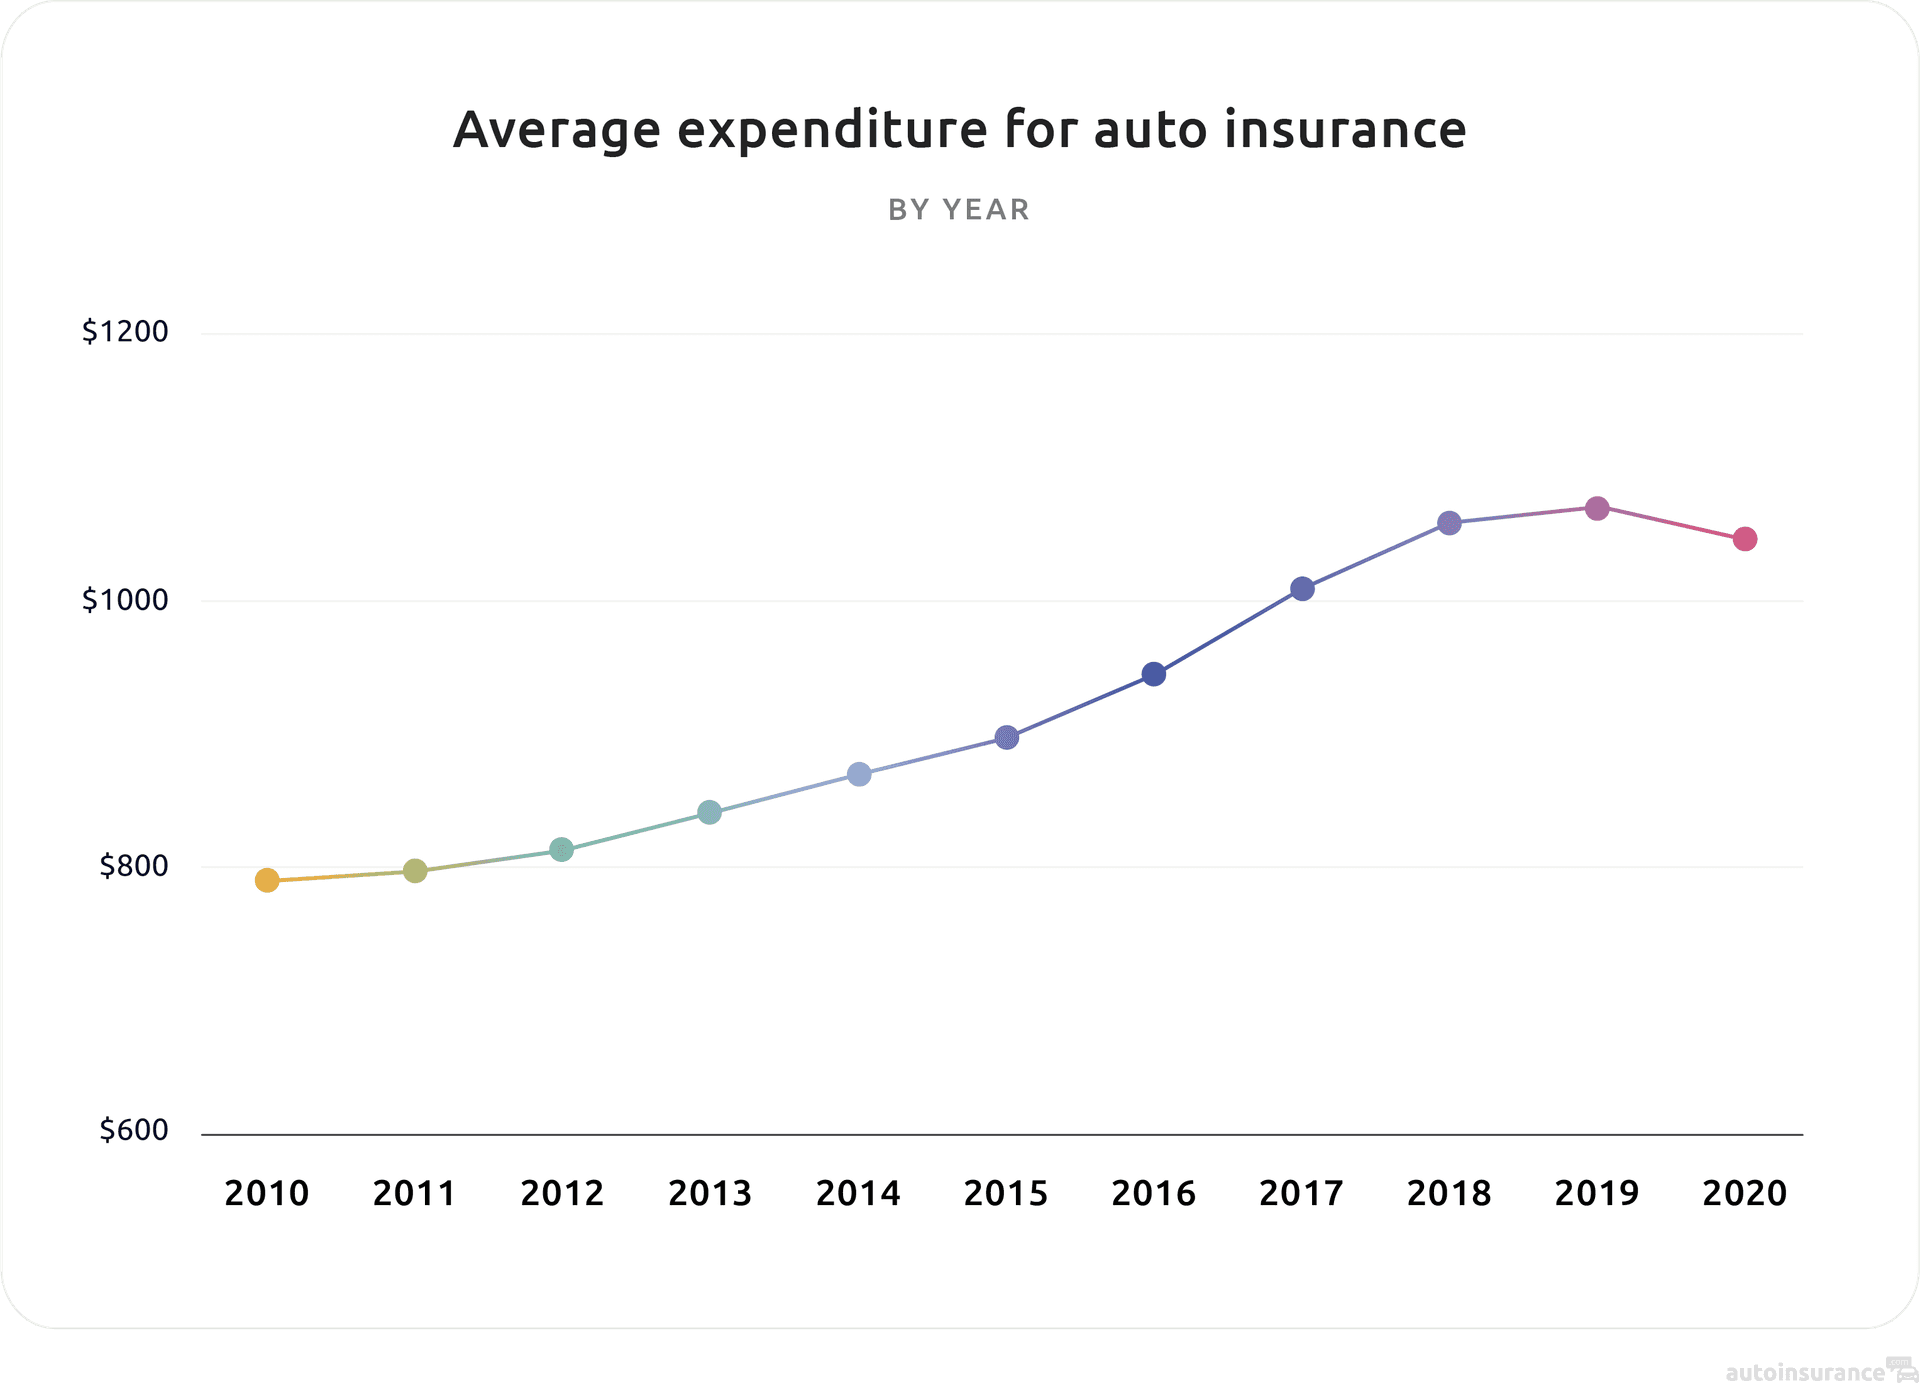
In 2020, car insurance in the U.S. cost $1,047 on average. Data for 2021 and 2022 is not yet available.
By State
While Louisiana and New York had the highest car insurance rates in 2020, North Dakota and Maine had the lowest. Learn how to get cheap car insurance in New York.
| State | Average annual expenditure on car insurance, 2020 |
|---|---|
| Alabama | $918 |
| Alaska | $970 |
| Arizona | $1,042 |
| Arkansas | $879 |
| California | $1,050 |
| Colorado | $1,172 |
| Connecticut | $1,229 |
| Delaware | $1,252 |
| Florida | $1,372 |
| Georgia | $1,255 |
| Hawaii | $810 |
| Idaho | $724 |
| Illinois | $915 |
| Indiana | $766 |
| Iowa | $708 |
| Kansas | $793 |
| Kentucky | $909 |
| Louisiana | $1,495 |
| Maine | $704 |
| Maryland | $1,201 |
| Massachusetts | $1,170 |
| Michigan | $1,419 |
| Minnesota | $881 |
| Mississippi | $979 |
| Missouri | $909 |
| Montana | $834 |
| Nebraska | $796 |
| Nevada | $1,247 |
| New Hampshire | $848 |
| New Jersey | $1,334 |
| New Mexico | $905 |
| New York | $1,436 |
| North Carolina | $753 |
| North Dakota | $692 |
| Ohio | $781 |
| Oklahoma | $888 |
| Oregon | $952 |
| Pennsylvania | $969 |
| Rhode Island | $1,391 |
| South Carolina | $1,113 |
| South Dakota | $739 |
| Tennessee | $854 |
| Texas | $1,085 |
| Utah | $937 |
| Vermont | $786 |
| Virginia | $846 |
| Washington | $1,035 |
| Washington, D.C. | $1,415 |
| West Virginia | $915 |
| Wisconsin | $753 |
| Wyoming | $770 |
| Countrywide | $1,047 |
By Carrier
On average, the cheapest company for car insurance in 2023 is Metromile, with average annual car insurance premiums of only $662. Metromile is a pay-per-mile insurance company, much like the second cheapest, Root. Metromile claims that on average, its drivers save 47 percent on premiums, but this type of insurance is only a good option for low-mileage drivers.
| Company | Average annual cost of car insurance, 2023 |
|---|---|
| Metromile | $662 |
| Root | $829 |
| Erie | $1,084 |
| Clearcover | $1,119 |
| USAA | $1,151 |
| GEICO | $1,194 |
| Safeco | $1,373 |
| Gainsco | $1,389 |
| Concord | $1,396 |
| American Family Insurance Group | $1,400 |
| State Farm | $1,419 |
| Progressive | $1,508 |
| Plymouth Rock | $1,513 |
| AARP (The Hartford) | $1,520 |
| Lemonade | $1,590 |
| Nationwide | $1,614 |
| Travelers | $1,620 |
| Liberty Mutual | $1,637 |
| Kemper | $1,661 |
| Allstate | $1,673 |
| Amica | $1,688 |
| Mercury | $1,706 |
| GMAC (National General Insurance) | $1,714 |
| Esurance | $1,724 |
| Farmers | $1,878 |
| AAA | $1,903 |
| Good2Go | $2,040 |
| Dairyland | $2,105 |
| 21st Century | $2,112 |
| The General | $2,418 |
| Direct | $2,487 |
| Foremost | $2,897 |
| Infinity | $2,908 |
| Bristol West | $2,910 |
By Age
Teen drivers have the highest auto insurance costs due to their lack of driving experience and, thus, their propensity to have insurance claims. Rates tend to decline with age, as young drivers gain more experience behind the wheel.
| Age | Average annual auto insurance rates, 2023 |
|---|---|
| 16 | $4,368 |
| 17 | $3,925 |
| 18 | $3,953 |
| 19 | $2,758 |
| 20 | $2,931 |
| 21 | $1,910 |
| 22 | $1,670 |
| 23 | $1,551 |
| 24 | $1,456 |
| 25 | $1,728 |
| 26 | $1,688 |
| 27 | $1,664 |
| 28 | $1,648 |
| 29 | $1,630 |
| 30 | $1,716 |
| 31 | $1,548 |
| 32 | $1,546 |
| 33 | $1,540 |
| 34 | $1,540 |
| 35 | $1,449 |
| 36 | $1,520 |
| 37 | $1,518 |
| 38 | $1,514 |
| 39 | $1,514 |
| 40 | $1,710 |
| 45 | $1,366 |
| 50 | $1,489 |
| 55 | $1,276 |
| 60 | $1,425 |
| 65 | $1,321 |
| 70 | $1,584 |
| 75 | $1,887 |
| 80 | $1,933 |
| 85 | $2,416 |
Learn about car insurance discounts for teens you can use to save money.
By Vehicle Type
According to a 2022 study from AAA, the cheapest type of vehicle to insure is a compact SUV with front-wheel drive (FWD). Medium-sized sedans are most expensive to insure due to poor safety ratings.2
| Vehicle type | Average annual cost of full coverage car insurance, 2022 |
|---|---|
| Compact SUV (FWD) | $1,515 |
| Subcompact SUV | $1,527 |
| Medium SUV (4WD) | $1,529 |
| Midsize pickup | $1,537 |
| Small sedan | $1,618 |
| Hybrid vehicle | $1,619 |
| Electric vehicle (EV) | $1,619 |
| 1/2 ton/crew cab pickup | $1,630 |
| Medium sedan | $1,694 |
| 2022 weighted average | $1,588 |
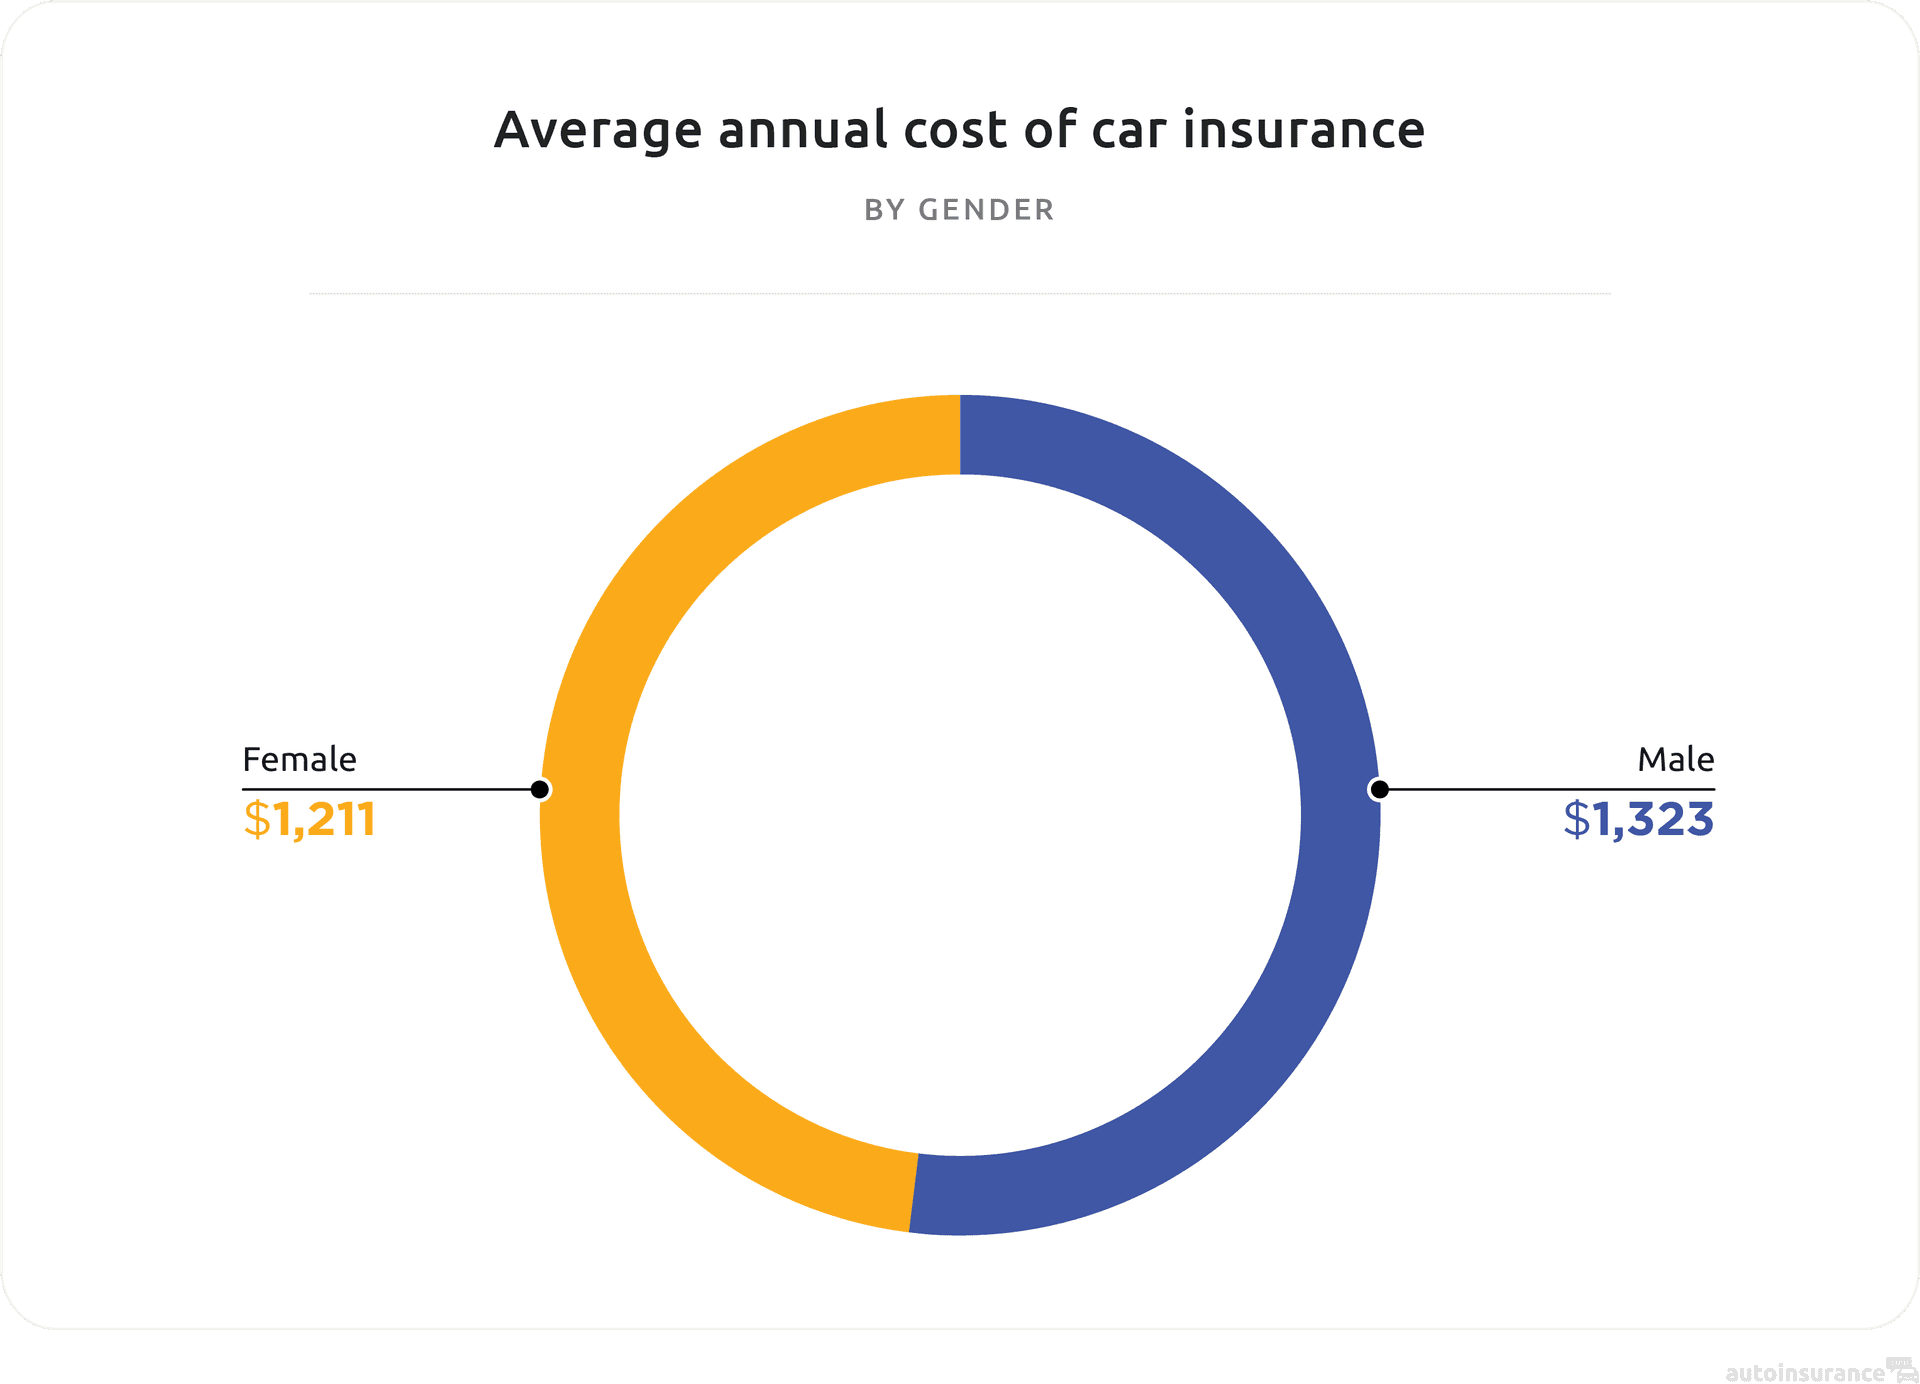
By Gender
Is it a myth that men pay more for car insurance than women? Unfortunately for males, the answer is no. Generally, men have higher insurance rates because they are more likely to get into accidents and file claims than women.
By Coverage Type
Liability coverage, composed of bodily injury and property damage coverage, is required in most states and accounts for the bulk of most people’s premiums, much more than collision/comprehensive coverage. Here are the NAIC averages nationwide.
| Coverage | Average annual cost of car insurance, 2020 |
|---|---|
| Liability coverage | $613 |
| Collision coverage | $371 |
| Comprehensive coverage | $174 |
Premiums vs. Household Income
As of 2018, Iowa and North Dakota residents spent the least on car insurance when compared to their income while Louisiana and Florida residents spent the most.3
| State | Car insurance expenditures as share of income, 2018 |
|---|---|
| Iowa | 1% |
| North Dakota | 1% |
| Hawaii | 1% |
| New Hampshire | 1% |
| Virginia | 1% |
| Vermont | 1% |
| Maine | 1% |
| Nebraska | 1% |
| Wisconsin | 1% |
| South Dakota | 1% |
| Minnesota | 1% |
| Utah | 1% |
| Wyoming | 1% |
| Idaho | 1% |
| Kansas | 1% |
| Indiana | 1% |
| Ohio | 1% |
| Washington | 1% |
| Illinois | 1% |
| Massachusetts | 1% |
| North Carolina | 1% |
| Alaska | 1% |
| Maryland | 1% |
| Oregon | 1% |
| Montana | 1% |
| California | 1% |
| Missouri | 1% |
| Tennessee | 2% |
| Pennsylvania | 2% |
| Colorado | 2% |
| Washington, D.C. | 2% |
| Connecticut | 2% |
| Arizona | 2% |
| Oklahoma | 2% |
| Kentucky | 2% |
| Arkansas | 2% |
| Alabama | 2% |
| West Virginia | 2% |
| New Jersey | 2% |
| New Mexico | 2% |
| South Carolina | 2% |
| Texas | 2% |
| Delaware | 2% |
| Nevada | 2% |
| New York | 2% |
| Rhode Island | 2% |
| Georgia | 2% |
| Mississippi | 2% |
| Michigan | 2% |
| Florida | 3% |
| Louisiana | 3% |
Why are the average costs of car insurance in Florida and Louisiana so high? Part of the reason may be the frequency of hurricanes in these states, the damage of which comprehensive coverage is responsible for covering. Comprehensive coverage applies to all the insured’s property damages from events other than collisions, including inclement weather, theft, vandalism, etc.
Car Insurance vs. Other Expenses
According to the U.S. Bureau of Labor Statistics’ (BLS’s) Consumer Price Index, the cost of medical care is the expenditure that’s increased the most in the past decade, not the cost of car insurance.4 However, the two are related, as car insurance covers claims related to bodily injuries. The below chart shows weighted representations of price changes compared to prices in the U.S. from 1982 to 1984 (represented as 100). Therefore, a data point of 147 means that the category increased by 47 percent in price since the early 1980s.
| Consumer price index for urban U.S. consumers, annual averages | Private passenger auto insurance | Food | Housing | Apparel | Transportation | Medical Care | Recreation | Education and communication |
|---|---|---|---|---|---|---|---|---|
| 2013 | 147 | 237 | 227 | 127 | 217 | 425 | 115 | 136 |
| 2014 | 150 | 243 | 233 | 128 | 216 | 435 | 116 | 138 |
| 2015 | 155 | 247 | 238 | 126 | 199 | 447 | 116 | 138 |
| 2016 | 162 | 248 | 244 | 126 | 195 | 464 | 117 | 139 |
| 2017 | 172 | 250 | 251 | 126 | 202 | 475 | 118 | 137 |
| 2018 | 180 | 254 | 258 | 126 | 211 | 485 | 119 | 137 |
| 2019 | 183 | 258 | 266 | 124 | 210 | 498 | 121 | 138 |
| 2020 | 185 | 267 | 272 | 118 | 202 | 519 | 122 | 140 |
| 2021 | 180 | 278 | 281 | 121 | 231 | 525 | 125 | 143 |
| 2022 | 188 | 305 | 301 | 127 | 266 | 547 | 131 | 144 |
| January 2023 | 197 | 320 | 314 | 129 | 263 | 552 | 134 | 145 |
Factors That Affect Rates
Take the average costs highlighted above with a grain of salt as there are many other factors that affect car insurance rates. These include:
- Deductible amounts
- Vehicle make, model and year
- Mileage
- Mailing address
- Driving record
- Credit scores in every state except Michigan, Massachusetts, Hawaii and California
- Homeownership status
Is Car Insurance Affordable?
For many, car insurance is affordable, especially if the customer:
- Has good credit
- Has a clean driving record
- Lives in a state like North Dakota where average costs of car insurance are low
- Is married
- Owns a home
- Has high deductibles
- Has good credit
- Lives in a suburban or rural area
- Has a vehicle with high safety ratings
- Has no gaps in insurance
- Is a woman
- Is over the age of 25
- Does not have a teen driver on their policy
- Stores their vehicle in a garage
However, your car insurance will be expensive if you:
- Have bad credit in states that allow companies to use credit scores when determining rates
- Rent your home
- Have a bad driving record with at-fault accidents, tickets, and/or DUIs
- Require an SR-22
- Have a lapse in coverage
- Live in a state where insurance is expensive, on average
- Live in a city with high rates of auto theft and car vandalism
- Are single, divorced or widowed
- Are a teen driver or someone with no driving history
- Have a vehicle with poor safety ratings
- Have high mileage
- Don’t garage your car and instead park it on the street
If you can’t find rates you can afford, check out our recommendations for the best cheap auto insurance.
Claims
Here are the most important, up-to-date statistics surrounding auto insurance claims.
Types of Claims Filed
In 2021, insurance customers filed collision claims the most, according to the latest data from the Insurance Services Office, a subsidiary of Verisk Analytics. Collision insurance pays for the insured’s property damage, whether they caused it. However, the most severe claims that year were bodily injury claims, meaning they had the highest number of incurred losses per claim.
| Claim type | Claim frequency in 2021 (incurred claims times 100 earned exposures) | Claim severity in 2021 (incurred losses divided by incurred claims) |
|---|---|---|
| Bodily injury | 0.78 | 22,734 |
| Property damage | 2.28 | 5,314 |
| Collision | 4.2 | 5,010 |
| Comprehensive | 3.15 | 2,042 |
Losses
When insurance companies pay out claims, they lose money (ideally for them, the amount is less than they collected in premiums). Let’s take a look at how much money insurance companies lost in 2021.
Incurred Losses
Private auto insurance companies lost nearly $170 billion in 2021, 57 percent of which was due to liability claims and 43 percent of which was due to physical damage, meaning collision or comprehensive claims.
| Private passenger auto incurred losses | Liability | Physical damage | Total |
|---|---|---|---|
| 2021 | $96,104,094 | $73,846,463 | $169,950,557 |
Collision Losses
Most collision claims involve passenger cars, although accidents with SUVs are the most severe. Across all types of passenger vehicles, insurance companies lose an average of $447 a year per insured vehicle.
| Collision coverage insurance losses by vehicle, 2019-2021 model years | Claim frequency per 100 insured vehicle years | Claim severity | Average loss payment per insured vehicle year |
|---|---|---|---|
| Passenger cars | 7.1 | 7,556 | $535 |
| Pickups | 5.5 | 7,571 | $413 |
| SUVs | 5.3 | 7,591 | $405 |
| All passenger vehicles | 5.9 | 7,579 | $447 |
Loss Ratios by Year
Loss ratios are incurred losses times 100, divided by earned premiums. In 2019, bodily injury claims had the highest loss ratio of 77, meaning companies lost 77 percent of their bodily injury premium earnings.
| Loss ratios by coverage, total business nationwide | 2017 | 2018 | 2019 |
|---|---|---|---|
| Bodily injury liability | 77 | 75 | 77 |
| Physical damage liability | 76 | 73 | 74 |
| Personal injury protection | 78 | 75 | 74 |
| Medical payments | 72 | 71 | 72 |
| Uninsured/underinsured motorist | 5 | 5 | 5 |
| Collision | 68 | 68 | 69 |
| Comprehensive | 83 | 71 | 72 |
For 2017-2019, the car insurance coverage with the best loss ratio was uninsured/underinsured motorist coverage, which covers accidents with people driving who have no or insufficient insurance. These types of claims are much less common than regular liability claims, as most people who drive have car insurance (although not all, as we’ll see below).
Loss Ratios by State
No wonder car insurance rates in Florida, New Jersey and New York are so high — these states have the highest bodily injury loss ratios of any state in the U.S., with ratios of 96, 94 and 94, respectively. Read more about no-fault auto insurance in Florida.
| Loss ratios by state in 2019, total business | Bodily injury liability | Physical damage liability | Personal injury protection (PIP) | Medical payments | Uninsured/underinsured motorist | Collision | Comprehensive |
|---|---|---|---|---|---|---|---|
| Alabama | 74 | 76 | N/A | 58 | 0 | 68 | 67 |
| Alaska | 80 | 74 | N/A | 77 | 11 | 65 | 62 |
| Arizona | 75 | 74 | N/A | 64 | 0 | 77 | 78 |
| Arkansas | 70 | 73 | 0 | 77 | 25 | 71 | 62 |
| Colorado | 73 | 65 | N/A | 72 | 2 | 64 | 69 |
| Colorado | 77 | 78 | N/A | 70 | 1 | 81 | 87 |
| Connecticut | 73 | 81 | 87 | 68 | 0 | 68 | 72 |
| Delaware | 87 | 81 | 72 | 30 | 10 | 78 | 78 |
| Florida | 96 | 73 | 75 | 78 | 0 | 71 | 67 |
| Georgia | 83 | 73 | N/A | 74 | 12 | 66 | 66 |
| Hawaii | 58 | 88 | 59 | 73 | 0 | 74 | 55 |
| Idaho | 70 | 75 | N/A | 65 | 2 | 69 | 65 |
| Illinois | 71 | 83 | 0 | 71 | 2 | 73 | 83 |
| Indiana | 68 | 77 | N/A | 76 | 14 | 74 | 71 |
| Iowa | 67 | 79 | 0 | 72 | 0 | 76 | 70 |
| Kansas | 76 | 74 | 62 | 85 | 0 | 75 | 71 |
| Kentucky | 78 | 79 | 69 | 65 | 0 | 70 | 64 |
| Louisiana | 76 | 73 | N/A | 72 | 1 | 67 | 68 |
| Maine | 80 | 85 | N/A | 69 | 0 | 67 | 77 |
| Maryland | 86 | 77 | 72 | 81 | 23 | 72 | 72 |
| Massachusetts | 55 | 69 | 63 | N/A | N/A | 59 | 61 |
| Michigan | 62 | 46 | 78 | 26 | 0 | 76 | 82 |
| Minnesota | 62 | 82 | 69 | 69 | 0 | 80 | 86 |
| Mississippi | 78 | 76 | N/A | 72 | 22 | 71 | 65 |
| Missouri | 74 | 75 | N/A | 71 | 0 | 80 | 65 |
| Montana | 68 | 77 | N/A | 64 | 1 | 78 | 113 |
| Nebraska | 59 | 81 | N/A | 66 | 0 | 79 | 91 |
| Nevada | 81 | 76 | N/A | 72 | 0 | 74 | 63 |
| New Hampshire | 74 | 81 | N/A | 65 | 1 | 68 | 66 |
| New Jersey | 94 | 78 | 62 | 106 | 5 | 71 | 72 |
| New Mexico | 65 | 68 | N/A | 69 | 15 | 77 | 66 |
| New York | 94 | 82 | 86 | 76 | 0 | 71 | 73 |
| North Carolina | 86 | 94 | N/A | 75 | 6 | 65 | 76 |
| North Dakota | 57 | 80 | 63 | 533 | 0 | 71 | 78 |
| Ohio | 67 | 76 | N/A | 80 | 2 | 69 | 76 |
| Oklahoma | 65 | 76 | N/A | 61 | 0 | 76 | 54 |
| Oregon | 69 | 76 | 62 | 95 | 9 | 72 | 73 |
| Pennsylvania | 74 | 76 | 67 | 26 | 0 | 72 | 89 |
| Rhode Island | 74 | 87 | N/A | 84 | 9 | 71 | 83 |
| South Carolina | 73 | 77 | N/A | 69 | 11 | 70 | 63 |
| South Dakota | 56 | 84 | 0 | 64 | 0 | 84 | 73 |
| Tennessee | 72 | 78 | N/A | 65 | 27 | 74 | 64 |
| Texas | 76 | 63 | 64 | 52 | 0 | 61 | 66 |
| Utah | 78 | 76 | 65 | 153 | 1 | 76 | 68 |
| Vermont | 65 | 79 | N/A | 66 | 17 | 63 | 68 |
| Virginia | 78 | 79 | N/A | 70 | 16 | 70 | 74 |
| Washington | 59 | 73 | 81 | 87 | 16 | 72 | 67 |
| Washington, D.C. | 80 | 74 | 77 | 59 | 36 | 74 | 65 |
| West Virginia | 73 | 75 | N/A | 70 | 8 | 67 | 75 |
| Wisconsin | 66 | 80 | 0 | 69 | 1 | 77 | 73 |
| Wyoming | 78 | 75 | N/A | 77 | 0 | 74 | 119 |
| Nationwide | 77 | 74 | 74 | 72 | 5 | 69 | 72 |
Industry Statistics
Let’s zoom out and take a look at the auto insurance industry as a whole.
Market Share
In terms of direct premiums written, State Farm is the largest car insurance provider in the U.S. As of 2022, it held 16 percent of the market share, followed by GEICO and Progressive, which held 14 percent each.
| Company name | Number of direct premiums written, 2022 |
|---|---|
| State Farm | 41,665,754,230 |
| Berkshire Hathaway (GEICO) | 37,422,557,592 |
| Progressive | 35,852,921,113 |
| Allstate | 27,221,928,278 |
| USAA | 15,731,646,068 |
| Liberty Mutual | 12,774,289,952 |
| Farmers | 12,441,182,108 |
| Nationwide | 5,565,737,353 |
| American Family | 5,488,676,661 |
| Travelers | 5,328,114,931 |
| Kemper | 4,084,493,187 |
| Auto Club | 3,724,620,422 |
| Erie | 3,384,615,752 |
| Auto Owners | 3,328,108,487 |
| CSAA | 2,905,119,316 |
| Mercury | 2,613,420,137 |
| Hartford | 1,864,696,499 |
| Automobile Club | 1,798,242,315 |
| MAPFRE | 1,302,753,084 |
| The Hanover | 1,264,350,218 |
| Sentry | 1,235,209,587 |
| Country | 1,209,560,632 |
| Amica | 1,173,901,381 |
| New Jersey Manufacturers Group | 1,070,343,924 |
| Southern Farm Bureau | 1,070,294,201 |
| Industry total | 261,593,847,230 |
Segments
Marketing, or lead generation, is a huge component of the car insurance industry. Insurers market their services to different segments of the population. According to Equifax’s Data-Driven Marketing service, 87 percent of U.S. households are “attractive auto insurance prospects” based on their financial and credit data. However, only 1 percent are optimum or “preferred” customers who are more likely to have lower loss ratios. Similarly, only 14 percent have a higher than average “lifetime value” based on their credit reports, ages and incomes.
| Segment title | Percent of U.S. households |
|---|---|
| Auto insurance target | 87% |
| Life stage changes leading to new auto insurance | 75% |
| Multiple policy prospects | 29% |
| Likely to respond to auto insurance offer | 17% |
| High lifetime value households | 14% |
| Millennials ― multiple insurance policy prospects | 11% |
| Optimum auto insurance target | 1% |
For three-quarters of U.S. households, life events and changes in credit profiles lead them to get new car insurance, like when adding a teen driver to a policy or moving.5
The Future of Car Insurance
Where is car insurance headed? According to multiple reports from McKinsey, the future of car insurance will be greatly affected by autonomous vehicles, artificial intelligence (AI) and EVs.
- Self-driving cars: While drivers will still be held responsible for losses they cause when they’re in control of a vehicle, when a vehicle is in autonomous mode, the liability will shift to the manufacturer. Learn more about insurance for self-driving cars.
- AI: AI is taking over industries all over the world and car insurance is no exception. With cameras built into cars, AI can determine if an accident requires repairs, how to handle claims and which towing and repair companies to use.6
- EVs: Given U.S. President Joe Biden’s target of having half of all new cars sold be EVs by 2030, EVs will replace internal-combustion-engine (ICE) vehicles in terms of the types of cars insured.
Uninsured Drivers by State
Driving without insurance is illegal in 48 states and Washington, D.C. Despite that, nearly a third of drivers in Mississippi chose to ignore the law and drive uninsured in 2019. On the other end of the spectrum, only 3 percent of New Jersey drivers were without insurance that year, possibly due to the state’s low minimum insurance requirements — only $5,000 of property damage liability and $15,000 of medical payments coverage.7
| State | Estimated percentage of uninsured drivers, 2019 |
|---|---|
| Alabama | 20% |
| Alaska | 16% |
| Arizona | 12% |
| Arkansas | 19% |
| California | 17% |
| Colorado | 16% |
| Connecticut | 6% |
| Delaware | 9% |
| Florida | 20% |
| Georgia | 12% |
| Hawaii | 9% |
| Idaho | 13% |
| Illinois | 12% |
| Indiana | 16% |
| Iowa | 11% |
| Kansas | 11% |
| Kentucky | 14% |
| Louisiana | 12% |
| Maine | 5% |
| Maryland | 14% |
| Massachusetts | 4% |
| Michigan | 26% |
| Minnesota | 10% |
| Mississippi | 29% |
| Missouri | 16% |
| Montana | 9% |
| Nebraska | 9% |
| Nevada | 10% |
| New Hampshire | 6% |
| New Jersey | 3% |
| New Mexico | 22% |
| New York | 4% |
| North Carolina | 7% |
| North Dakota | 13% |
| Ohio | 13% |
| Oklahoma | 13% |
| Oregon | 11% |
| Pennsylvania | 6% |
| Rhode Island | 17% |
| South Carolina | 11% |
| South Dakota | 7% |
| Tennessee | 24% |
| Texas | 8% |
| Utah | 7% |
| Vermont | 9% |
| Virginia | 11% |
| Washington | 22% |
| Washington, D.C. | 19% |
| West Virginia | 9% |
| Wisconsin | 13% |
| Wyoming | 6% |
| Average | 12% |
Conclusion
Although from 2019 to 2020, the average cost of auto insurance decreased for the first time since 2011, we expect insurance rates to increase in a post-pandemic world thanks to the rise of inflation and, thus, higher gas prices, repair prices and car prices — all of which can affect the cost of insurance. Explore more of our auto insurance research or read our frequently asked questions below for even more information.
Methodology
To compile this report, we analyzed data from the following third parties:
- Experian
- Insurance Research Council
- McKinsey
- NAIC
- BLS
We also used our proprietary data on auto insurance prices stemming from over 20 years of connecting customers with car insurance providers.
Frequently Asked Questions
Two important facts about auto insurance are:
- Every state requires auto insurance except New Hampshire and Virginia.
- Liability insurance covers the other party’s damages and injuries, not yours or your passengers’. For that, you’d need collision and comprehensive coverage, plus medical payments coverage or personal injury protection, depending on your state’s fault system.
The 80/20 rule in car insurance is that the insurance company will pay for 80 percent of your damages while you, the insured, will pay the remaining 20 percent. This agreement lets both parties resolve disputes quickly and without a legal process, saving everyone time and money.
The 21-day rule for car insurance, a concept popularized by financial journalist Martin Lewis, means that if someone is 21 days from renewing their auto insurance policy, that is the best time for them to obtain a new quote to ensure there is no gap in coverage and get the best prices. Insurance companies will see you as lower risk and thus will give you lower rates.
A good rule of thumb for car insurance is having liability limits of 100/300/100, meaning:
- Bodily injury per person: $100,000
- Bodily injury per accident: $300,000
- Property damage per accident: $100,000
Citations
2019/2020 Auto Insurance Database Report. National Association of Insurance Commissioners. (2023, Jan).
https://content.naic.org/sites/default/files/publication-aut-pb-auto-insurance-database.pdfYour Driving Costs. AAA. (2022).
https://newsroom.aaa.com/wp-content/uploads/2022/08/2022-YDC-Costs-Break-Out-by-Category.pdfAuto Insurance Affordability: Countrywide Trends and State Comparisons. Insurance Research Council. (2021, Sep 28).
https://www.insuranceresearch.org/sites/default/files/news_releases/IRC%20Auto%20Affordability%20Research%20Brief_0.pdfEconomic News Release. (U.S. Bureau of Labor Statistics). (2023, Jan).
https://www.bls.gov/news.release/cpi.t01.htmInsurance. Equifax. (2023).
https://datadrivenmarketing.equifax.com/digital-targeting-segments/insurance/Connected revolution: The future of US auto insurance. McKinsey & Company. (2022, Sep 15).
https://www.mckinsey.com/industries/financial-services/our-insights/connected-revolution-the-future-of-us-auto-insuranceGet Legal with New Jersey’s Basic Auto Insurance Policy. State of New Jersey Department of Banking & Insurance. (2023).
https://www.state.nj.us/dobi/division_consumers/insurance/basicpolicy.shtml
Related Articles

Senior Driver Facts and Statistics
March 30, 2026
Best Affordable Car Insurance With Low Credit
November 4, 2025
2026 Rideshare Statistics
May 6, 2026